MODAL SHIFT AS A MEANS FOR ECONOMIC AND SALUBRIOUS ROAD COMMUTE FOR THE STATE OF TAMIL NADU
Balamurugan G, Praveen Paul J and Gopi S
Department of Management Studies, Mepco Schlenk Engineering College, India
10.21917/ijms.2017.0066
Abstract
Tamil Nadu is one of the states in India that has an excellent transportation system. In the recent past, there is a wide gap in the development of Public and Personal commuting system. The daily usage ratio of these two modes is 0.2:99.8. This leads to an inefficient and ecologically degrading system of transportation. A study on the daily commuting pattern of people and their intention for a modal shift was done. Based on their intention, it is attempted to find a possible eco-friendly change in the road transportation for Tamil Nadu. The results are encouraging. The study is done with a survey on modal shift intention in select districts of Tamil Nadu and is evaluated with an adopted simulation for the carbon emission reduction along with economic and environmental benefits. The outcomes are significant for the entire country as it evidences a favourable economic and eco-friendly road commuting with a considerable reduction in the fuel consumption.
Keywords:Road Transport, Public Commuting, Modal Shift, Cost Saving, Policy
1. INTRODUCTION
Tamil Nadu, a state in India has one of the best road transport systems in India catering to the need of the people of Tamil Nadu with a total road length of 1,32,320.20 km [1]. There are nearly 35000 buses in service for the daily commuting of passengers [2]. The state being the hub of the automobile industry, there are nearly 17 million two wheelers on road used by the people for their conveyance in addition to the personal usage of 18, 61,057 cars as on May 2015 as seen in Table.1 [2]. Thanks to the liberal policies of the Indian government and the State government, this growth in terms of number of vehicles for people, help them travel comfortably.
On the flip side of the liberal policies related to automobiles, the rapid growth in personal vehicle density [3] has brought in its wake a range of serious socioeconomic impact [4]. It has resulted in more congestion on roads [5], increase in the pollution level [6] [7], enormous demand for fuels [8] [9], high demand for foreign exchange and it is reflected on the domestic inflationary pressure [10].
With all these vehicles on road, the quantum of carbon emission for the entire transit distance of these vehicles is very high. It is estimated in this study that there is an emission of 17,174 kilograms of carbon just for a kilometre run of these vehicles (Table.4). The United Nations estimated that over 600 million people in urban areas worldwide were exposed to dangerous levels of traffic-generated air pollutants [11]. It is also established that motor vehicles are a major source of environmental and noise pollution in urban areas [12]. Among all other externalities, this excessive carbon emission seems to be an alarming one and may cause serious consequences on the health perspective rather than the economic perspective [13], [14]. Air pollution adversely affecting human health is established in numerous studies [15] - [17].
Keeping this in view, this research attempts to reorient the road commuting in Tamil Nadu as an economic and eco-friendly system by trading off between public transport mode and personal transport mode.
1.1 PROLIFERATION OF PERSONAL VEHICLES AND PROBLEMS THEREOF
There are many issues pertaining to the proliferation of personal vehicles on road. Traffic congestion is a problem in many cities of the World, both in developed and developing countries and it is predicted that it will get worse in the future [18],[19]. In India, the public sector road transport occupies an important position in the economy and the buses are the very popular mode of transportation because of its low cost [20]. The State Road Transport Undertakings (SRTUs) in India, with 58 members, forms the backbone of mobility for urban and rural population across the country. They ply over 1,15,000 buses, serving more than 65 million passengers a day and also providing employment directly to 0.8 million people. The SRTUs are facing tremendous challenges in achieving sustainable transportation issues such as energy consumption and environmental pollution [21]. Two wheelers are considered as the main component of the existing traffic congestion [22].
Carbon emission due to increased vehicle pollution causes health related problems such as respiratory disease, risk of developing cancer and other serious ailments etc., [23] and also contributes to tremendous economic loss by way of giving medical assistance to the affected people [5].
Of late many countries have tried to limit the utilization of personal transport mode favouring public transport mode [5]. The poor utilization of the public transit in most of the Indian cities results in numerous consequences of rising personal vehicle (two wheelers) population [5], [24] and it accounted for the share of 72.4 percent of India’s total vehicle population [25]. The total number of registered two wheelers increased at a rate of 13.3 percent during 2011-12 [25] and in 2013-2014, the sales of the two wheelers in India reached multi fold growth [3]. If the personal vehicle users go for a modal shift to public transportation, then the problems may be mitigated [26]. The United States Environmental Protection Agency (USEPA) has initiated many countries to make changes in their public transportation policies to maximize the public transport utility [13].
Air pollution due to personal vehicles is one of the serious environmental concerns of the urban Asian cities including India, where majority of the population is exposed to poor air quality [7], [13]. The link between the growth of personal vehicle population and enormous demand of fuel and carbon emission is an accepted fact [13], [10]. The transportation sector consumes 21 percent of primary energy and account for 20 percent of greenhouse emissions worldwide [20], [27].
Most of the Indian cities are also experiencing rapid urbanization which may continue for the next two decades leading to a tremendous increase in the number of motor vehicles [27]. Modal shift from personal transport to public transport is recognized as one of the key strategies for reduction of energy consumption [28] and carbon emission reduction in transport sector [21], [29]. Promoting public transport mode as a choice for the daily commute is a requirement to meet the future mobility demand. [30] have evidenced the effects of service quality and perceived value of public transit on the behavioural intention of passengers. On contrary to the exponential growth of personal vehicles, public transport system has not improved significantly in Tamil Nadu [31], [32]. Due to the degradation of bus service quality and insecurity of bus transport, the motor cycle is preferred as the primary mode of transport by students and employees with its convenience and flexibility nature [33]. The cumulative side effects of this proliferation of personal vehicles need attention and demand an alternate means
1.2 PRESENT SYSTEM OF ROAD TRANSPORT IN TAMIL NADU
The road transport system considered for the study has been confined to the public transport vehicles (MTS - Mass Transit System) which includes Buses (MTSb) with a maximum seating capacity of sixty passengers and Minibuses (MTSm) with a maximum seating capacity of twenty five passengers and to the personal transport vehicles such as Motor bikes, Scooters and Mopeds (PeTS). The number of vehicles in each category as on May 2015 in Tamil Nadu is presented in Table.1.
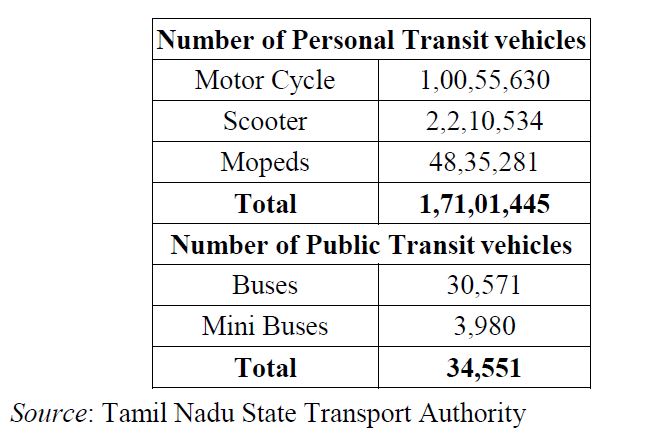
Table.1. Number of personal and public transit vehicles in Tamil Nadu
Travel demand has grown historically as the income level of people has risen. This has been the case for both personal travel and freight transport [34]. The personal mode of commuting has increased in the recent past as purchasing power of people has improved and wide choices of vehicles are available for them to choose. Because of this, commuters’ personal travel comfort would have become better. But the socio environmental effect of this multiple growth of personal vehicles is becoming a concern on environmental and health aspects in the state. The change in number of public transport vehicles for the past five years in Tamil Nadu is presented in Table.2.
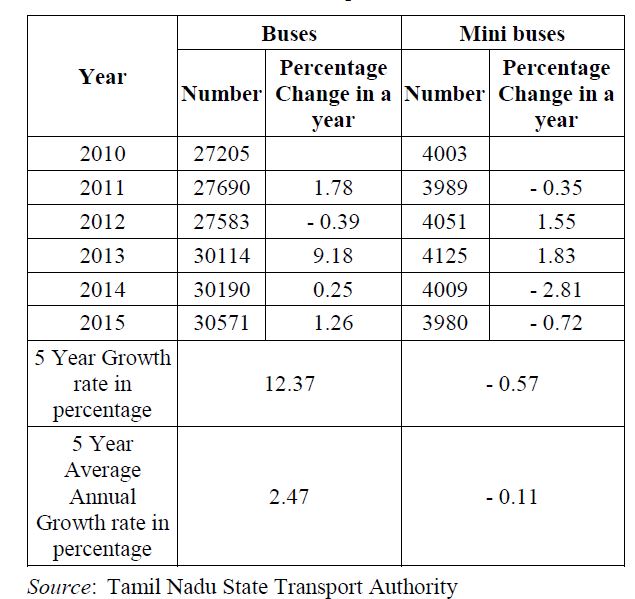
Table.2. Growth of Public Transport vehicles in Tamil Nadu
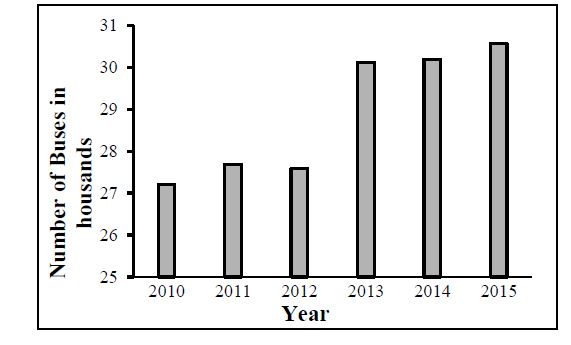
Fig.1. Change in number of Buses in Tamil Nadu in the past five years
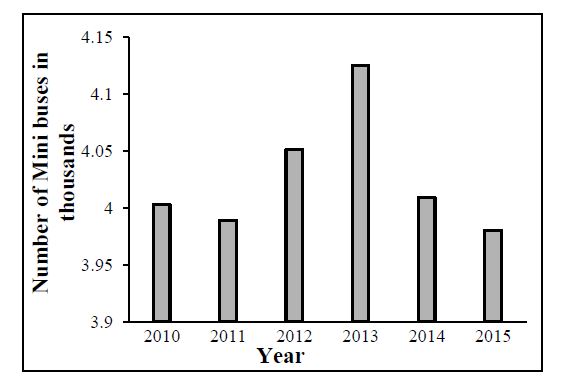
Fig.2. Change in number of Mini buses in Tamil Nadu in the past five years
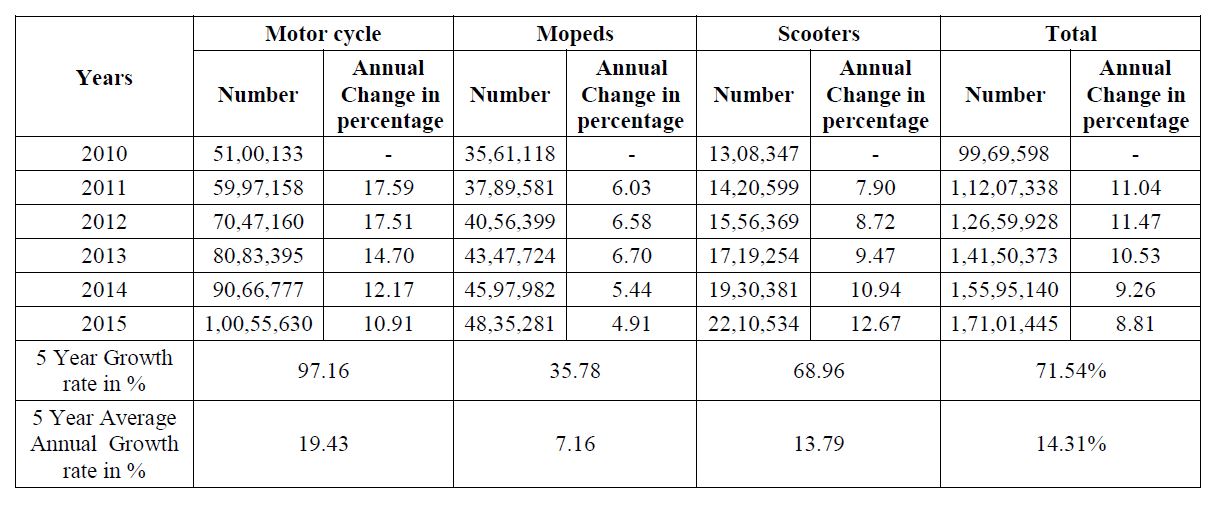
Table.3. Growth of Personal vehicles in Tamil Nadu
It is observed from Table.2 that the Public road transport system in Tamil Nadu has witnessed an average annual growth rate of 2.47 percent in bus category (MTSb) and has a negative average annual growth rate of - 0.114 percent in the minibus category (MTSm). The total growth of public transport vehicles (MTS, mass transit system includes both MTSb and MTSm) was around 12 percent in the last 5 years. The Fig.1 shows the change in number of buses for the past five years in Tamil Nadu.
Except for a small increase in the number of buses in 2013, there is no significant increase in the number of buses in the last three years.
The change in the number of minibuses for the past five years in Tamil Nadu is depicted in Fig.2. The Fig.2 indicates a drastic decrease in the number of mini buses for the past two years, which might have forced commuters to choose PeTS. This view is supported by the results of the survey among the commuters as part of this study. The growth of Personal vehicles in Tamil Nadu is shown in Table.3 and illustrated in Fig.3.
Fig.3. Change in number of Personal Vehicles in Tamil Nadu in the past five years
In contrast to the low growth of mass transport vehicles, the number of personal vehicles has grown with its peak value of 71.54 percent totally in the last 5 year period. All categories of personal vehicles have seen a positive growth with an annual average growth of 19.43 percent in motor cycles, 7.16 percent in mopeds and 13.79 percent in scooters during 2010 to 2015. There seems to be an exorbitant growth and also an unbalanced growth in the personal vehicles in the state. This unprecedented growth in personal vehicles might have given a more convenient travel for the people but the cost effectiveness of personal transportation, health aspects and environmental impact are questionable. This unbalanced policy approach on the road transportation system needs to be addressed.
1.3 CURRENT ECONOMIC ISSUES IN ROAD COMMUTING
India is spending its foreign exchange of Rs.7090 billion per annum on importing crude oil for meeting its energy demand for transportation [35]. In using this import of crude oil for transportation purpose, conservation may be possible by use of most efficient transportation mode in place of less efficient mode for the regular transit of the people. It is estimated that a saving of Rs.80 billion to Rs.100 billion can be done just by a possible and viable change of mode of transport and that savings will be a result of mere 2 to 2.5 percent conservation of petroleum products [36]. The public transportation system can be replaced for personal transport system in order to create an efficient and eco-friendly road commuting system [28] [37]. Both the systems are going to use the same petroleum products but are different in terms of usage, efficiency, effectiveness and the residual effects on the environment. Car use for commuting causes pollution and congestion, thus policies aimed at reducing car use will be more effective when commuters are willing to reduce it [38]. Lea and Trinh [33] have confirmed the preference of public transport by students and employees who presently use motorbikes, understanding the negative effects of personal vehicles in Vietnam. This is true with the case of Tamil Nadu also which is revealed in this study
2. MEANS FOR ECONOMIC AND SALUBRIOUS ROAD COMMUTING SYSTEM
The argument of this research is that if the public transportation system is deployed more in the State of Tamil Nadu, there seems to be a possibility of commuters moving from personal vehicles to public vehicles, which has its own advantages for the economy (Survey Results), economies of individuals and of course on environment [4], [39]. This requires a significant modal shift among the commuters of Tamil Nadu. This modal shift is the means for an economic and salubrious road commuting system. The simulation results of the current study made, evidences a positive effect in economic and health perspectives.
The economies behind this is that, a proportionate modal shift leads to petroleum conservation for the state and personal cost savings on fuel to the commuters. This is revealed from the study, that just 1percent increase in the public transport vehicles replacing the personal vehicles saves 522.12 liters of petrol per kilometer run and saves fuel cost for the commuters (Table.8).
Also it is a known fact that the petroleum products are the largest sources of carbon emission brought into the environment through transportation vehicles [36]. The envisaged modal shift will result in the reduction of carbon emission too, caused by the transport sector.
Based on the number of vehicles available in Tamil Nadu, the amount of carbon emission per kilometre run of these vehicles is estimated and it is given in Table.4.
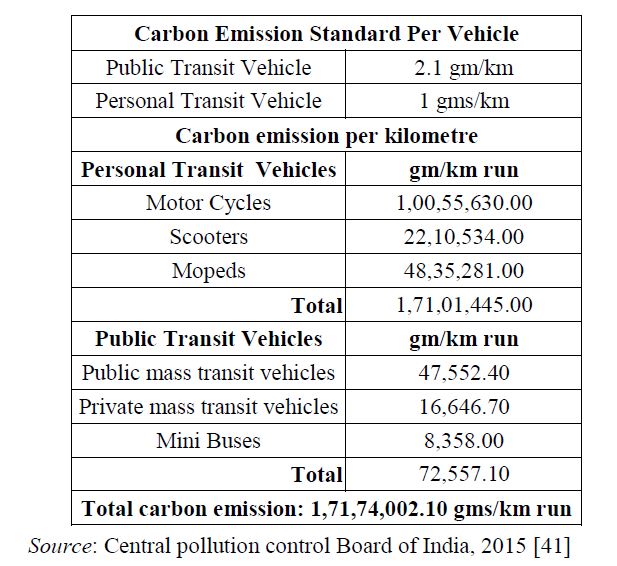
Table.4. Amount of carbon emission per kilometre run of different vehicles in Tamil Nadu
The total carbon emission per kilometre run is found as 17174 kg of carbon of which 99.58 percent of the emission is from the personal transit vehicles and only 0.42 percent is attributed to the public transit vehicles. If the same emission is calculated per person’s transit, it amounts to 1gm per kilometre for personal vehicle like motorbike, scooter, moped and just 0.035 gms and 0.084 gms per kilometre for bus and minibus respectively. The basic assumption of this trade off logic is that when one MTSb vehicle is introduced, sixty PeTS users switch over to that MTSb and when one MTSm vehicle is added, twenty five PeTS users switch over to that MTSm. The effect of this switch over is that if one MTSb is added to the system and in turn 60 personal vehicle users are switching to the public transport system (bus), there is going to be a net reduction of 57.9 gms of carbon emission per kilometer (2.1 gms for one MTSb less 60gms for 60 PeTs). Keeping this kind of transport modal shift by commuters in mind, the following propositions are formulated.
- Proposition 1: increasing both MTSb and MTSm by 1 percent step from 1 percent to 20 percent and thereby shifting of PeTS passengers to MTS proportionally
- Proposition 2: increasing only the MTSb by 1 percent step from 1 percent to 20 percent and thereby shifting of PeTS passengers to MTS proportionally
- Proposition 3: increasing only the MTSm by 1 percent step from 1 percent to 20 percent and thereby shifting of PeTS passengers to MTS proportionally
2.1 MODAL SHIFT INTENTION - AN ASSESSMENT
To ascertain the reality of the above assumption of modal shift from PeTs to MTS, a survey was conducted among the commuters from select places of Tamil Nadu to know their intention and preference towards the public transport system for a possible modal shift. The results are encouraging and strengthening the modal shift viability. The major findings from the survey are:
- Of the total respondents of personal vehicle users, 80.17 percent of them are in favour of public mode of transport and 43.94 percent of them are commuting on a fixed path daily.
- People who commute daily on a fixed path using own personal vehicle (43.94 percent of total) expressed their willingness to go for a transport modal shift, provided the public transport system is improved. They expect additional bus services, good maintenance of the buses, reasonable fare, good road condition and additional routes introduction.
- 57.64 percent of the personal vehicle commuters very strongly expressed their modal shift intention, if additional bus services are provided
- Most of those who use personal vehicles are currently using it for two primary reasons namely inadequate bus services and peak time overcrowding in the public buses.
- Respondents who belong to middle and low middle class are ready for a modal shift for the purpose of cost saving if additional services are provided.
- All the respondents are fully aware that the modal shift will definitely benefit their living in terms of cost, health, safety and will reduce the pollution to the environment. Also, they are aware of the economic benefits to the nation.
- The average distance travelled by PeTS commuters per day is 22.63 kms.
A profile of the survey conducted among the commuters from various parts of Tamil Nadu is presented in Table.5 and Table.6. The Table.5 shows the places where the survey was conducted. The Table.6 gives the demographic profile of the respondents
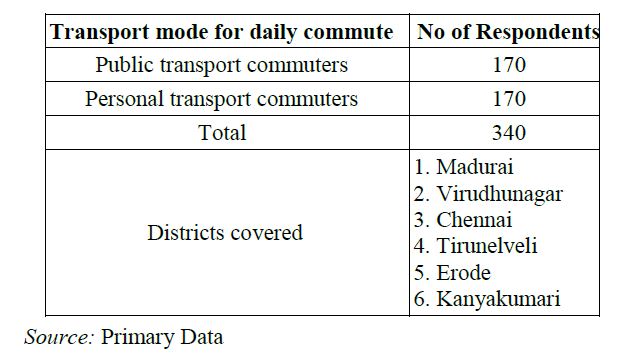
Table.5. Profile of commuters from various places of Tamil Nadu
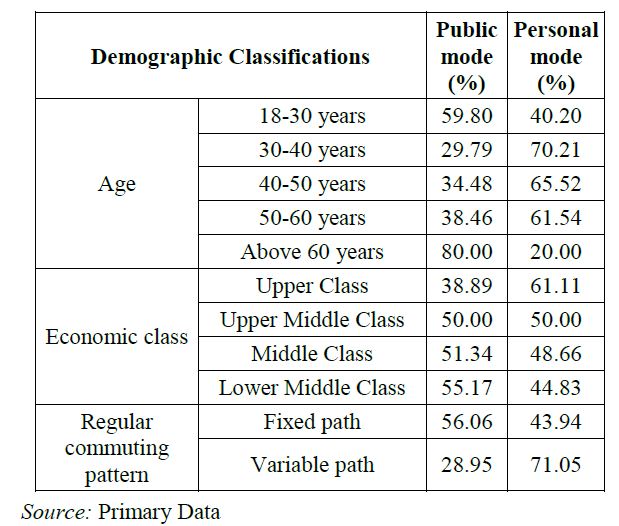
Table.6. Demography of Respondents
Source: Primary Data There are many factors identified in the survey that motivate the people to choose public mode over personal mode of transport. The response of the respondents on the motivating factors to choose MTSb and MTSm is shown in Table.7. Prime motivator is found to be additional bus services. This aligns with the focal point of this research.
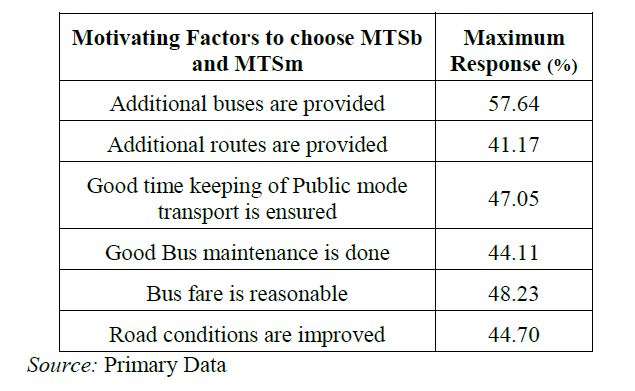
Table.7. Motivating Factors to choose MTSb and MTSm
3. POLICY APPROACH FOR AN ECONOMIC TRANSPORTATION SYSTEM
A simple framework relating the commuter’s intention and the transport policy change by the policy makers is presented in Fig.4. If the Government decides to improve the Public transportation system (MTS) and in turn the personal mode commuters’ shift to public mode, the effects would be definitely positive. The externalities of the present transportation system will get reduced to a greater extent. Among the various impact of fuel conservation, carbon emission reduction, lesser global warming, better traffic and other personal health benefits for commuters, the effects of modal shift on carbon reduction and fuel conservation are estimated through the simulations and those results are given in Table.8 to Table.10.
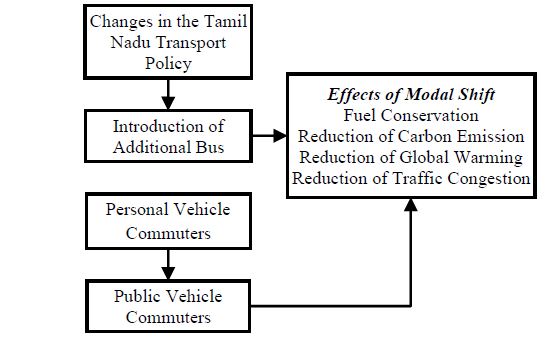
Fig.4. Approach for an Eco-friendly Transportation System
The Transport policy can be used as a powerful tool to reduce the carbon emission drastically by capitalizing the modal shift intention of commuters. A model on carbon emission pattern developed in this line of thinking has revealed very healthy and effective outcomes for the people, economy and environment
3.1 ECONOMIES OF MODAL SHIFT
With the background information on the willingness of the people for a modal shift from the survey, simulations have been done on the three propositions discussed above using the expression for Level of Carbon Emission (LoCE) developed by Balamurugan, et al. [31]. The outcomes of the simulations include Level of carbon emission added to the environment on road for a kilometer operation of vehicle in terms of grams per passenger served, Carbon reduction per kilometer operation in kilograms, Total fuel savings per kilometer in liters, and total Carbon reduction for an average run of a commuter per day in kilograms. Those outcomes of the simulations are presented in Table.8, Table.9 and Table.10.
From Table.8 it can be observed that the level of carbon emission in total reduces by 2.26 percent for a mere one kilometer run if additional 20 percent MTS vehicles are introduced. The fuel savings are found to be more than 10,000 liters per kilometer run and if the same is extrapolated for the total run of the vehicles there will be a huge savings for the country and also for the individuals.
Considering the average run of commuters (22.63 kms through PeTS), an individual contribution to the carbon reduction by their modal shift is ranging from 437.29 kilograms for 1 percent change in MTS to 8745.84 kilograms for 20 percent change in MTS. This is also a significant phenomenon which will have a positive effect on the environment and economy.
The results in Table.9 show that the level of total carbon emission is getting reduced by 2.15 percent for a mere one kilometer run if additional 20 percent MTS vehicles are introduced. The fuel savings are found to be nearly 9,900 liters per kilometer run. The individual contribution to the carbon reduction by modal shift is at the maximum of 8308.85 kilograms. This is also found to be very significant.
The outcomes of the simulation for proposition 3 shown in Table.10 are not substantial when compared with the previous propositions in terms of expected results
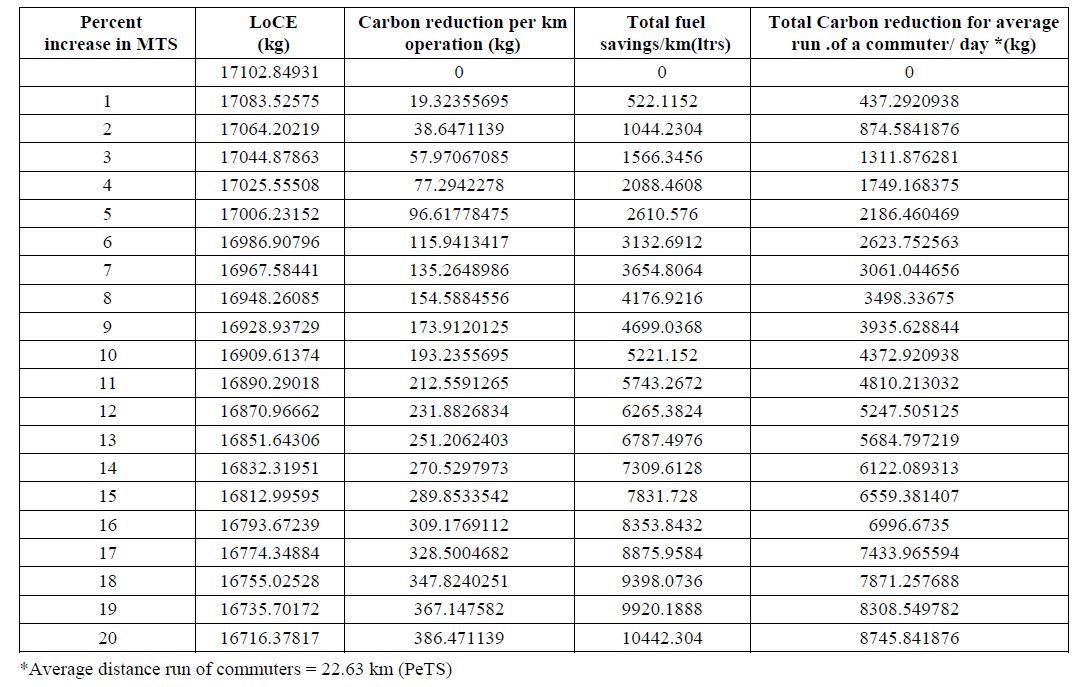
Table.8. Simulation for Proposition 1- Increasing MTS (both MTSb and MTSm) by 1 percent step from 1 percent to 20 percent and thereby shifting of PeTS passengers to MTS proportionately
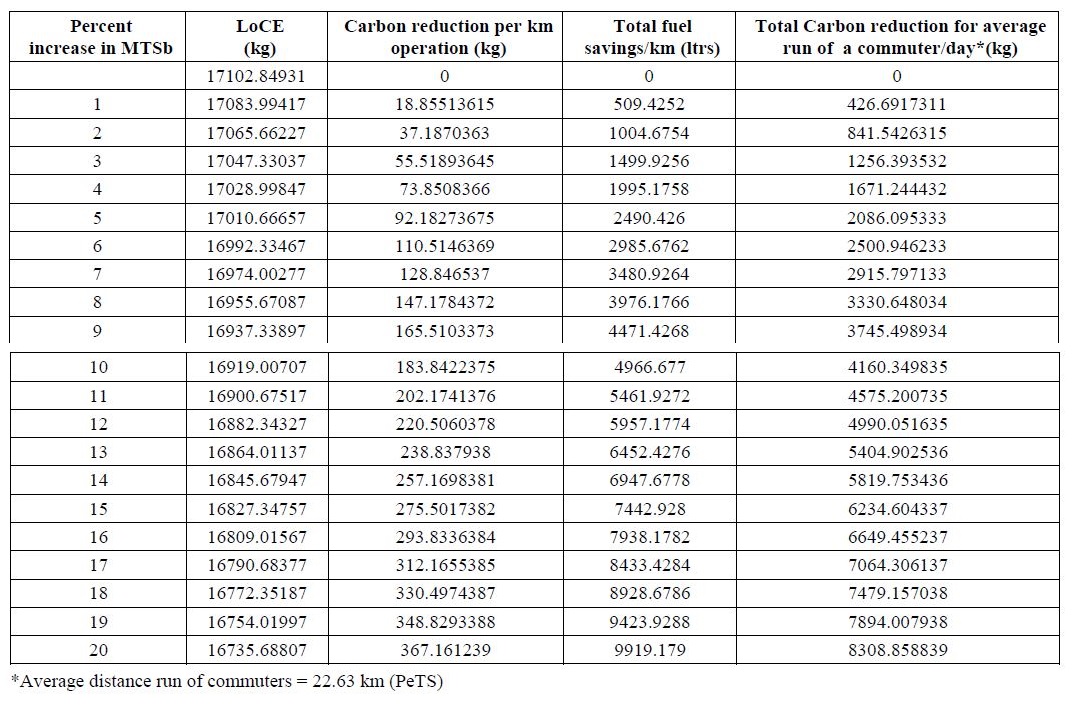
Table.9. Simulation for Proposition 2- Increasing only the MTSb by 1 percent step thereby shifting of PeTS passengers to MTS proportionately
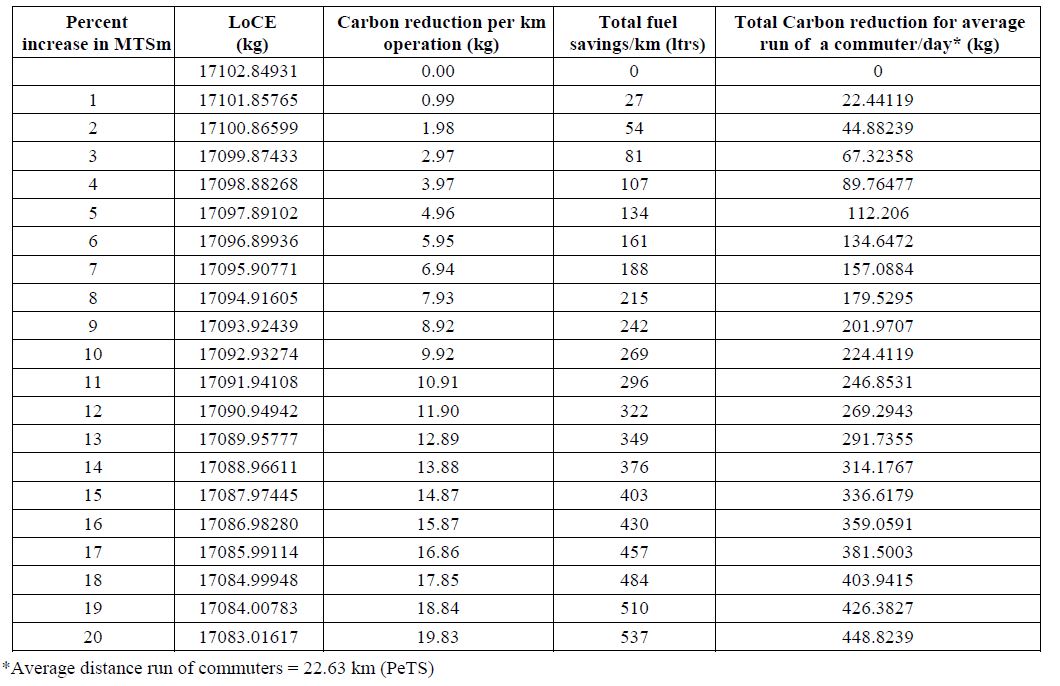
Table.10. Simulation for Proposition 3- Increasing only the MTSm by 1 percent step thereby shifting of PeTS passengers to MTS proportionately
4. RESULTS AND DISCUSSION
The results of the simulation (Table.8, Table.9 and Table.10) show a distinct pattern in terms of carbon reduction. The level of carbon reduction pattern for the three simulated situations is plotted in Fig.5. Comparing the results of the simulations it can be seen that the levels of carbon reduction is at its best when a combination of MTSb and MTSm are operated additionally as posited in proposition 1. There is no significant benefit on carbon reduction while increasing only the MTSm (proposition 3). However addition of MTSm will benefit the semi-urban and rural commuters for their economic development.
Addition of more public mode of transport facilities coupled with a modal shift by the commuters will lead to a salubrious road commuting for the people of Tamil Nadu. The health hazards of the air pollution due to carbon emission will reduce drastically and this in turn will reduce the money spent on medical expenses. This paves way towards a green transport system for Tamil Nadu.
The economic benefit of modal shift as a means to achieve a better road commute is the fuel savings. It is estimated in the study that a mere one percent increase in MTS saves nearly Rs. 32000 on fuel cost for shifting commuters. If twenty percent of MTS is introduced for regular road commuting, there will be a fuel saving value of nearly Rs.0.625 million for commuters collectively. All these estimations are for a kilometer run only. If the same is extrapolated for the total travel distance of commuters, the road transport in Tamil Nadu will become a real economic system. The economic benefits on the fuel savings are depicted in Fig.6.
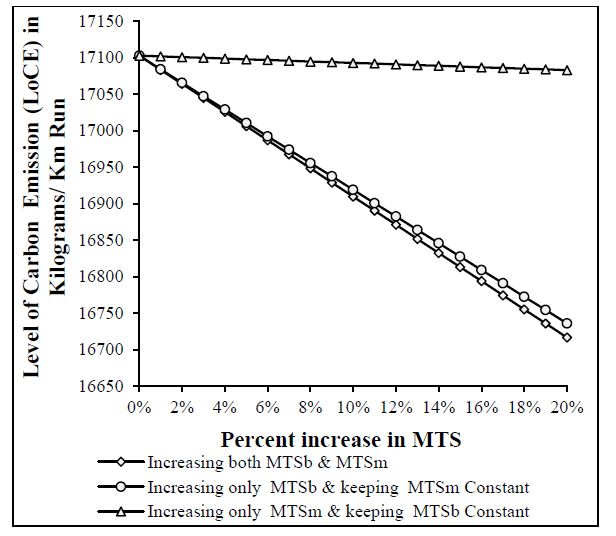
Fig.5. Simulation results on carbon emission after modal shift
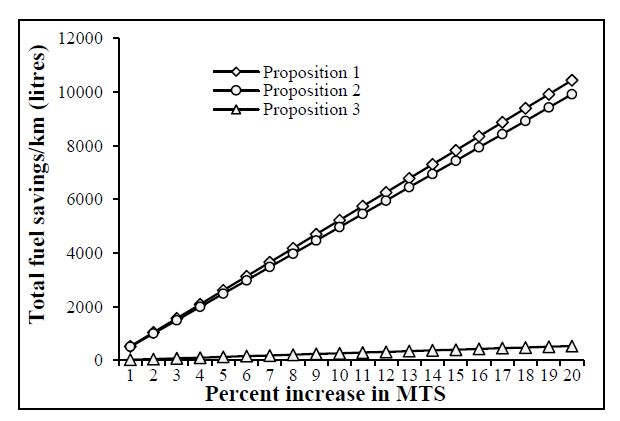
Fig.6. Simulation results on Fuel savings after modal shift
aProposition 1: increasing both MTSb and MTSm by 1 percent step from 1 percent to 20 percent and thereby shifting of PeTS passengers to MTS proportionally
bProposition 2: increasing only the MTSb 1 percent and reducing PeTS proportionally
bProposition 3: increasing only the MTSm 1 percent and reducing PeTS proportionally
From the above results it is clear that when both MTSb and MTSm are increased, the benefits to the individuals, state and the nation seem to be enhanced multifold both economically and environmentally.
The set propositions have been confirmed empirically and the results are found to be environmentally and economically encouraging. The inferences are just for a kilometre operation of these vehicles in Tamil Nadu. If the same is extrapolated for the entire travel distance pan India, the results will be immense. But for this to happen, there is a need for major policy changes in the related issues on the Government’s part and a little awareness on the part of the commuters. The government needs to increase the number of buses and mini buses between places where there are large number of daily commuters such as students, employees who travel in a fixed path. This may require a significant amount investment from the exchequer. Looking at the long term environmental and economic benefits, the investment is of value.
5. CONCLUSION
eco-friendly road commuting system possibility in the state of Tamil Nadu, India. It indicates that a slight modification of transportation policy can bring a remarkable positive change in the environment and also can provide a greater economic advantage. In a similar context, Bhuiyan Alam [40] concluded in their investigation on factors for transit travel demand done in US that the policy makers can attract and increase bus transit ridership by adjusting a few significant factors specific to their transit systems. The present study gains importance in the light of the world grappling with the increasing carbon emission and its outfall of global warming. Since India has also taken carbon emission reduction as an agenda as part of the world’s concern over climate change, the study is very relevant for today’s context. When a sustainable transport model can bring in environmental and economic advantages, adopting it should not be a hurdle as the people are ready for a modal shift for their daily commute. The study confirms the viability of an economically better road commuting system proposed for Tamil Nadu through its positive and favorable results.
ACKNOWLEDGEMENT
The authors would like to acknowledge with thanks, All India Council for Technical Education (AICTE), New Delhi for their financial support through Research Promotion Scheme Ref. No.: 20/AICTE/RIFD/RPS (POLICY-III) 128/2012-13 and also the authorities of Mepco Schlenk Engineering College, Sivakasi for their encouragement and constant support.
REFERENCES
[1] Statistical Hand Book of Tamil Nadu, Available at: http://www.tn.gov.in/deptst/, Accessed on 2015.
[2] Vehicle Statistics, Tamil Nadu State Transport Authority, Available at: http://www.tn.gov.in/sta/stat1.html.
[3] Economic Times, “Bajaj Aims 25% Growth in two-Wheeler Sales in 2014-15 PTI”, Available at: http://economictimes.indiatimes.com/industry/auto/two-wheelers/bajaj-aims-25-growth-in-two-wheeler-sales-in-2014-15/articleshow/32010671.cms, Accessed on 2014.
[4] Madhav G.Badami, “Transport and Urban Air pollution in India”, Environmental Management, Vol. 26, No. 2, pp. 195-204, 2005.
[5] Abdalla Nurdeen Kamba, Riza Atiq and Amiruddin Ismail, “Why Do People Use Their Cars: A Case Study in Malaysia”, Journal of Social Sciences, Vol. 3, No. 3, pp. 117-122, 2007.
[6] Charles Raux, “The Potential for CO2 Emission Trading in Transport: the Case of Personal Vehicle and Freight”, Energy Efficiency, Vol. 3, No. 2, pp. 133-148, 2010.
[7] Richard Dahl, “Heavy Traffic Ahead: Car Culture Accelerates”, Environmental Health Perspectives, Vol. 113, No. 4, pp. 238-245, 2005.
[8] Peter J. Marcotullio and Niels B. Schulz, “Comparison of Energy Transitions in the United States and Developing and Industrializing Economies”, World Development, Vol. 35, No. 10, pp. 1650-1683, 2007.
[9] Nielsen, “All India Study on Sectoral Demand of Diesel and Petrol”, Available at: http://ppac.org.in/WriteReadData/Reports/201411110329450069740AllIndiaStudyonSectoralDemandofDiesel.pdf, Accessed on 2013.
[10] Peter Newman and Jeffrey Kenworthy, “Sustainability and Cities; Overcoming Automobile Dependency”, 1st Edition, Island Press, 1999.
[11] R.R. Cacciola, M. Sarva and R. Polosa, “Adverse Respiratory Effects and Allergic Susceptibility in Relation to Particulate Air Pollution: Flirting with Disaster”, European Journal of Allergy and Clinical Immunology, Vol. 57, No. 4, pp. 281-286, 2002.
[12] D. Schwela, S. Kephaloupoulos and D. Prasher, “Confounding or Aggravating Factors in Noise-Induced Health Effects: Air Pollutants and Other Stressors”, Noise and Health, Vol. 7, No. 28, pp. 41-50, 2005.
[13] D. Rojas-Rueda, A. De Nazelle, O. Teixido and M.J. Nieuwenhuijse, “Replacing Car Trips by Increasing Bike and Public Transport in the Greater Barcelona Metropolitan Area: A Health Impact Assessment Study”, Environment International, Vol. 49, pp. 1000-109, 2012.
[14] Amer Aziz and Ihsan Ullah Bajwa, “Minimizing Human Health Effects of Urban Air Pollution through Quantification and Control of Motor Vehicular Carbon Monoxide (CO) in Lahore”, Environmental Monitoring and Assessment Vol. 1, No. 3, pp. 459-464, 2007.
[15] U.S. Environmental Protection Agency Office of Air and Radiation, “The Benefits and Costs of the Clean Air Act: 1990 to 2020”, Final Report, Available at: http://www.eenews.net/assets/2011/03/01/document_gw_03.pdf.
[16] World Health Organization, “Health Risks of Ozone from Long-range Transboundary Air Pollution”, Available at: http://www.euro.who.int/__data/assets/pdf_file/0006/78657/E88189.pdf
[17] J.G. Ayres, “The Mortality Effects of Long-Term Exposure to Particulate Air Pollution in the United Kingdom”, Technical Report, Committee on the Medical Effects of Air Pollutants, 2010.
[18] Traffic Congestion and Reliability: Linking Solutions to Problems, Available at:https://ops.fhwa.dot.gov/congestion_report_04/executive_summary.htm
[19] V. Jain and A.Sharma and L. Subramanian, “Road traffic congestion in the developing World”, Proceedings of 2nd ACM Symposium on Computing for Development, Vol. 11, pp. 1-10, 2012.
[20] International Energy Agency, “World Energy Outlook”, Available at: http://www.worldenergyoutlook.org/media/weowebsite/2008-1994/WEO2006.pdf
[21] Baijayanta Kumar Majumdar, Amit Dutta, Shibnath Chakrabarty and Subhabrata Ray, “Assessment of Vehicular Pollution in Kolkata, India, using Caline 4 Model”, Environmental Monitoring and Assessment, Vol. 170, No. 1, pp. 33-43, 2010.
[22] Sanjay Kumar Singh, “Urban Transport in India: Issues, Challenges, and the Way Forward”, European Transport, Vol. 52, No. 5, pp. 1-26, 2012.
[23] Henry Wohrnschimmel, Miriam Zuk, Gerardo Martinez-Villa, Julia Ceron, Beatriz Cardenas, Leonora Rojas-Bracho and Adrian Fernandez-Bremauntz, “The Impact of a Bus Rapid Transit system on commuters Exposure to Benzene, CO, PM2.5 and PM10 in Mexico City”, Atmospheric Environment, Vol. 42, No. 35, pp. 8194-8203, 2008.
[24] Dane Westerdahl, Xing Wang, Xiaochuan Pan and K. Max Zhang, “Characterization of On-Road Vehicle Emission Factors and Micro Environmental Air Quality in Beijing, China”, Atmospheric Environment, Vol. 43, No. 3, pp. 697-705, 2009.
[25] Road Transport Year Book, Available at: http://in.tool-alfa.com/LinkClick.aspx?fileticket=RhX00HSiIT4%3D&tabid=72&mid=486
[26] M. McDonald, D. Harrow, D. Bayliss, P. Stevens, D. Scott-Hellewell and L. Christensen, “Movement in the New Millennium”, RSA Journal, Vol. 148, No. 5496, pp. 74-77, 2010.
[27] R.K. Shrivastava, Saxena Neeta and Gautam Geeta, “Air Pollution Due To Road Transportation in India: A Review on Assessment and Reduction Strategies”, Journal of Environmental Research And Development, Vol. 8, No. 1, pp. 69-77, 2013.
[28] Ari Rabl and Audrey de Nazelle, “Benefits of Shift from Car to Active Transport”, Transport Policy, Vol. 19, No. 1, pp. 121-131, 2012.
[29] J. Praveen Paul, G. Balamurugan and S. Gopi, “Model Creation for Sustainable Efficient and Eco-Friendly Road Commuting System in Tamil Nadu”, Proceedings of International Conference on Green Technology for Environmental Pollution Prevention and Control, pp. 1-6, 2014.
[30] Wen-Tai Lai and Ching-Fu Chen, “Behavioral Intentions of Public Transit Passengers-the Roles of Service Quality, Perceived Value, Satisfaction and Involvement”, Transport Policy, Vol. 18, No. 2, pp. 318-325, 2011.
[31] G. Balamurugan, J. Praveen Paul and S. Gopi, “Developing Mass Transit System for Environmental Friendly Commuting System-Go Public Go Green”, ICTACT Journal on Management Studies, Vol. 1, No. 3, pp. 143-145, 2015.
[32] U.K.M. Riza, “Urban Transport Management System”, Engineering Faculty, University Kebangsaan Malaysia, 2004.
[33] Thi Phuong Linh Lea and Tu Anh Trinh, “Encouraging Public Transport use to Reduce Traffic Congestion and Air Pollutant: A Case Study of Ho Chi Minh City, Vietnam”, Procedia Engineering, Vol. 142, pp. 236-243, 2016.
[34] David Metz, “Demographic Determinants of Daily Travel Demand”, Transport Policy, Vol. 21, pp. 20-25, 2012.
[35] Ministry of Statistics and Programme Implementation, “Crude Oil Import Statistics”, Available at: http: //mospi.nic.in / Mospi_New/upload/India_in_ figures - 2015.pdf, Accessed on 2015.
[36] Petroleum Conservation Research Association, Available at: http://www.pcra.org/pcra_adm/writereaddata/upload/reportts/pcra_annua_report_english_2014-15.pdf
[37] Fabio Caiazzo, Akshay Ashok, Ian A. Waitz, Steve H.L. Yim and Steven R.H. Barrett, “Air Pollution and Early Deaths in the United States. Part I: Quantifying the Impact of Major Sectors in 2005”, Atmospheric Environment, Vol. 79, pp. 198-208, 2013.
[38] Wokje Abrahamse, Linda Steg, Robert Gifford and Charles Vlek, “Factors Influencing Car use for Commuting and the Intention to Reduce it: A Question of Self-Interest or Morality?”, Transportation Research Part F: Traffic Psychology and Behaviour, Vol. 12, No. 4, pp. 317-324, 2009.
[39] Amela Ajanovic, Carol Dahl and Lee Schipper, “Modeling Transport (Energy) Demand and Policies-An Introduction”, Energy Policy, Vol. 41, pp. 3-14, 2012.
[40] Bhuiyan Alam, Hilary Nixon and Qiong Zhang, “Investigating The Determining Factors for Transit Travel Demand By Bus Mode in US Metropolitan Statistical Areas”, MTI Report, Mineta Transportation Institute, pp. 1-58, 2015.
[41] Central Pollution Control Board of India, “Vehicular Exhaust”, Available at: http://cpcb.nic.in/Vehicular_Exhaust.php, Accessed on 2015.