ICTACT Journal on Management Studies
Volume 2, Issue 2 - May 2016
LIQUIDITY AND SOLVENCY ANALYSIS: A CASE STUDY OF AUTO MANUFACTURING INDUSTRY IN INDIA
K. Kanaka Raju
Department of Management Studies, Andhra University, India
DOI: 10.21917/ijms.2016.0041
Abstract :
Liquidity is the more important aspect to run the business without any interruption. The main objectives of this paper are to test whether there is any significant difference between one variable to another variable and know the relationship in each other with a suitable suggestions to strengthen liquidity position of the automobile industry. The data obtained from the annual reports of the automobile industry and the study period was the 2002-03 to 2014-15 and the SPSS 16.0 version was applied to derive the results with a help of the statistical techniques of paired sample statistics, paired samples correlation and paired sample test. The study found that the more liquidity possessed by the Maruti Suzuki, followed by the Ashok Leyland, Mahindra & Mahindra, TVS Motor, Tata Motors and Hero Motor Corporation and some of the pairs positively correlated with a lesser relationship and the study also found that there was a significant difference from one variable to another variable within a pair regarding the current ratio as well as the quick ratio. But regarding quick ratio, its highest ratio was represented from the Maruti Suzuki, followed by the Mahindra & Mahindra, Ashok Leyland Tata Motors to Maruti Suzuki, TVS Motor and Hero Motor Corporation and they have a positively correlated except a few cases and also found that there was a significant difference from other except in the case of TVS Motor to Tata Motors . Hence, it is suggested that every company should maintain the optimum liquidity position to earn a maximum return even though the existing liquidity position was satisfactory.
Keywords:
Liquidity Analysis, Solvency Analysis, Maruti Suzuki, Ashok Leyland, Mahindra & Mahindra, Tata Motors and Hero Motor Corporation
1. INTRODUCTION
Liquidity may be defined as the ability to conform its short - term maturing obligations. The function of liquidity analysis is to quantify a company's ability to meet its short-term debt commitment. Liquidity means conversion of assets into cash during normal courses of business and to have a continuous\ stream of cash to meet outside current debt maturing within one year and also ensure money for day to day operations of business. For a firm that is consistently having difficulty taking on its short-term responsibility is at a higher danger of insolvency. The firm should maintain the adequate cash balance to consider the claims of short-term creditors, normal operations of business, payment of current interest and dividend requirements. Liquidity comprises of two aspects, time and risk. The time aspect of liquidity refers the speed of conversion of assets in to cash. The risk concern to the degree of certainty about the conversion of inventories, receivable and other assets is into cash with a minimum sacrifice in price. The presentation of financial condition and financial results through financial statement is a meaningless without having adequate cash balance to meet the maturing obligations. The liquidity of a firm varies based on the investment strategy, financial planning goals and risk management. The holding of cash facilitates the benefit of universal acceptance, low risk and the added benefit of almost immediate access in the event of an emergency. A percentage of liquidity reduces the overall risk of portfolio acting as an asset class that holds value. The factors which are affecting on liquidity are the availability of inventory supplies, short term borrowings, and information regarding cash flows, extent of delaying the payment to creditors and offering of cash discounts to customers for encouraging prompt payment. Inadequate liquidity results the loss of some opportunities or some lower purchase prices, deteriorating of the relationship with business partner due to the non-observance of the contracts involved, delays in the payments of the falling due rates and interest related to the loans, difficulties in obtaining of new credits and necessary to sell at a loss a part of the assets in order to be able to pay the current obligations. If a company fails to meet its current obligations, its continued existence is doubtful.
The working capital of a business represents the surplus quantity of current assets over current liabilities and it is free to work. It implies that the greater the quantity of working capital, the greater the degree of liquidity of the business. The word liquidity means "the amount of time that is expected to elope until an asset is realized or otherwise converted into cash or until liabilities has been paid", which was used by the financial accounting standard Board (FASB). Liquidity management involves of the amount of investment in the group of assets to satisfy short term maturing obligations. The major part of the fund needed for financing current assets is met from long-term sources and equity, while the balance is obtained from short-term sources. If the maturing commitments are met continuously this will build up the credit worthiness of the firm and the creditors will have confidence in the financial strength of the firm but Failure to meet such responsibilities on a continuous basis will affect the credit report of a firm, which will, in turn, make it more difficult to continue to finance the level of current assets from the short- term sources.
2. REVIEW OF LITERATURE
Arunkumar & Radharamanan [3], suggested that the managers can increase the rate of return by reducing cash conversion cycle and the long number of days of accounts payable would lead the firm to a low level of profitability and vice versa. They also found a significant positive relationship between the size of the firm and profitability. Mohammad Fawzi Shubita [4], results showed that there were significant negative relationship between profitability and the average number of day’s inventories, net trade cycle and the number of days payable. V. Sarangarajan et al. [5], suggested that if the assets were efficiently used, it would result in an increase in sales. Hamid & Waqar [7] examined the impact of working capital management on the firm’s profitability. The result indicated a positive relationship between profitability and working capital management. Almost all the components of working capital displayed significant positive relationship with profitability, which meant that efficient working capital management plays a role to increase profits of the firms. It was found that the slow collection of receivables is associated with low profitability and there is a negative relationship between the average numbers of days, the inventory is held and the profitability. Zahra Mousavi et al. [9] found that there was a negative relationship between working capital management and financial leverage and there was positive relationship between working capital management, net liquid balance and size of firm.
Besides, there was no relation between working capital management and Amarjit Gill et al. [2] found that leverage, operating cycle, return on assets, internationalization of the firm and Tobin’s q were the internal factors that influence working capital requirements significantly in the Canadian manufacturing industry. And added that operating cycle, return on assets, growth of sales and firm size influence the working capital requirements significantly in the Canadian service industry. The working capital requirements were different from industry-to-industry and country-to-country. Abdul Raheman et al. [1] concluded that there was a strong negative relationship between working capital ratios mentioned above and profitability of the firms. Furthermore, managers can create a positive value for the shareholders by reducing the cash conversion cycle up to an optimal level. Van Horne [8], studied a trade-off risk-return of working capital management in entirely new perspective by considering some of the variables probabilistically but the usefulness of the framework recommended by him was limited because of the difficulties in getting information about the possibility distributions of liquid-asset balances, the opportunity cost and the possibility of running out of cash for different alternative of debt maturities.
3. OBJECTIVES OF THE STUDY
After verifying the existing literature the following objectives were designed.
- To test whether there is any significant difference fromone variable to another variable within a pair regardingthe current ratio as well as the quick ratio.
- To know the relationship between from one variable toanother variable within a pair from quick ratio andcurrent ratio.
- To know which variable is better out of the two variableswith in a pair to know the liquidity position of the company.
- To offer a suitable suggestions to strengthen the liquidityposition of the automobile industry.
4. METHODOLOGY OF THE STUDY
The data collected from the primary as well as the secondary sources. The secondary data obtained from the annual reports of the Hero Motor Corporation, TVS Motor, Ashok Leyland, Tata Motors, Mahindra & Mahindra, and Maruti Suzuki etc. The data period confined to the 2002-03 to 2014-15 and the SPSS 16.0 version applied to infer the results. The techniques of paired samples statistics, paired samples correlations and paired samples tests were applied to derive the results and conclusions.
5.DATA ANALYSIS
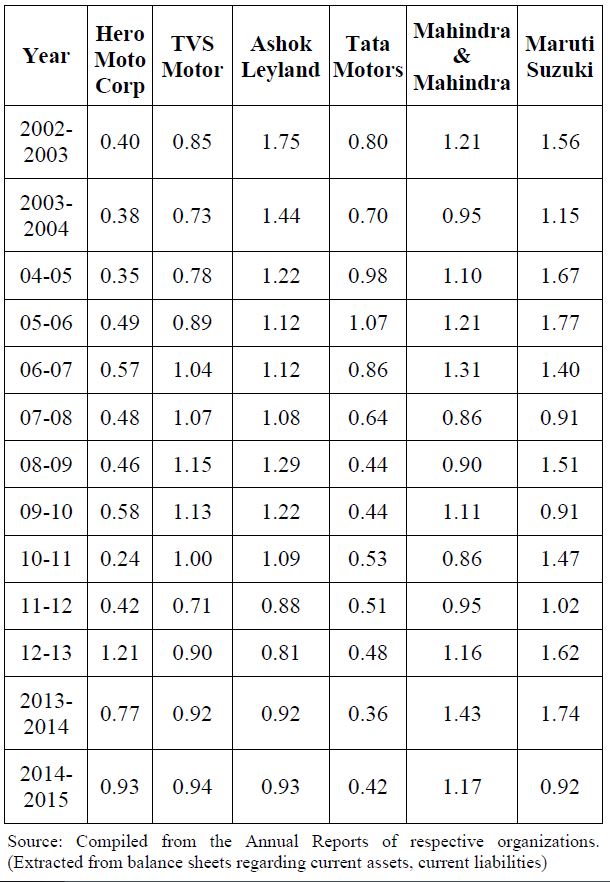
Table.1. Current Ratio of Different Firms with in an Auto-Mobile Industry from the Year 2002-03 to 2014-15
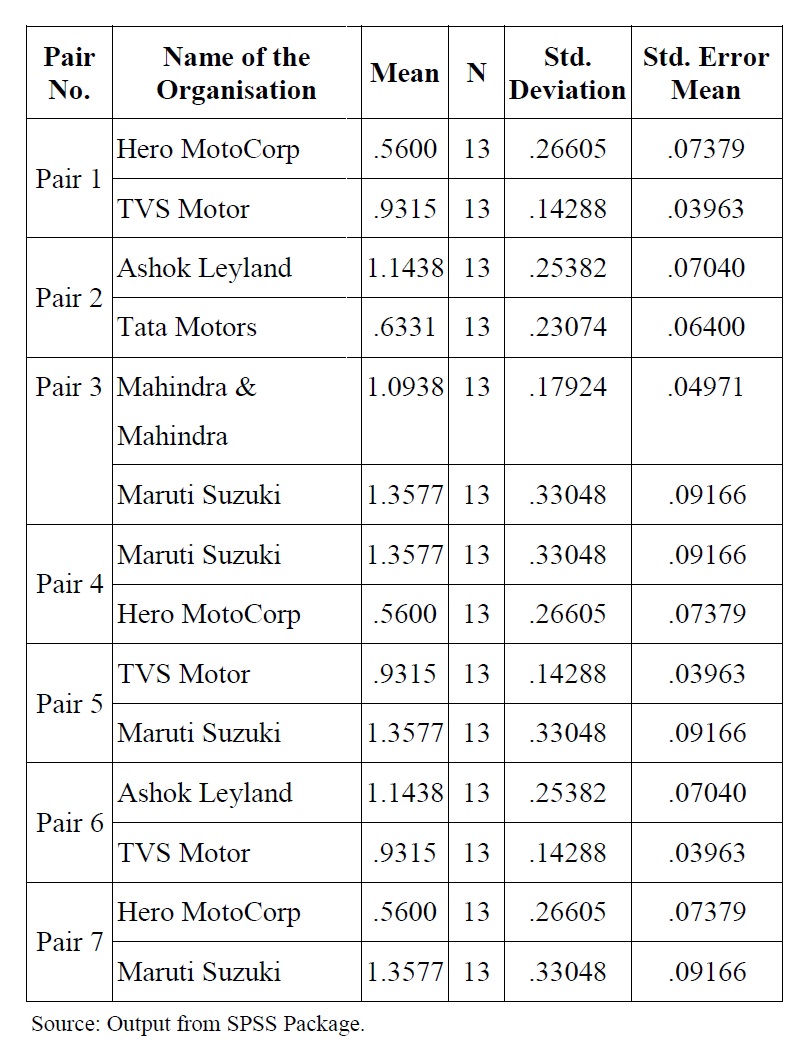
Table.2. Paired Samples Statistics Current Ratio of Different Firms with in an Auto-Mobile Industry from the Year 2002-03 to 2014-15
The Table.2 describes the paired samples statistics with the help of various pairs regarding the current ratio. The current ratio of TVS Motor Company was the higher than that of Hero Motors Corporation, and the Ashok Leyland current ratio exceeds the current ratio of Tata Motors Company, but the ratio of Mahindra & Mahindra to Maruti Suzuki lesser than but there was a wider variation between Hero Motor Corporation to the Maruti Suzuki, and Maruti Suzuki ratio exceeds the TVS Motors ratio and the Ashok Leyland possessing more liquidity than the TVS Motor Company and in the same way the liquidity position of the Maruti Suzuki was higher than that of the Hero Motor Corporation. Finally it can be concluded that the higher amount of liquidity possessed by the Maruti Suzuki Company followed by the Ashok Leyland, Mahindra & Mahindra, TVS Motor, Tata Motors and Hero Motor Corporation.
The Table.3 describes the relationship between two variables. The pairs Hero Motor Corporation and TVS Motor, Ashok Leyland and Tata Motors and Mahindra & Mahindra with Maruti Suzuki, Maruti Suzuki and Hero Motor Corp, Hero Motor Corp and Maruti Suzuki were the positively correlated but they related with moderate relationship. The remaining pairs namely, TVS Motor and Maruti Suzuki, Ashok Leyland and TVS Motor was negatively correlated and having lesser weak relationship.
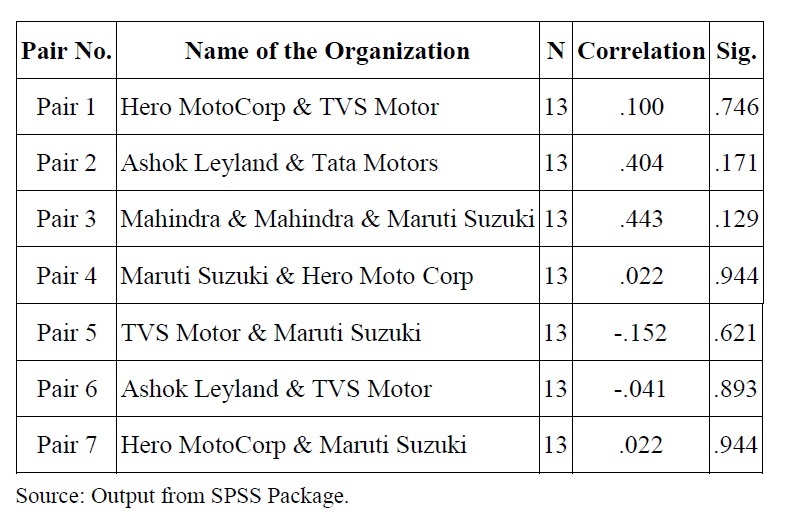
Table.3. Paired Samples Correlations of Current Ratio of Different Firms with in a Auto-Mobile Industry from the Year 2002-03 to 2014-15
5.1 HYPOTHESIS 1
Null Hypothesis (H0): There is no significant difference between liquidity positions (Current Ratio) of Hero Motor Corporation to liquidity position of TVS Motor.
Alternative Hypothesis (Ha): There is a significant difference between liquidity positions (current ratio) of Hero Motor Corporation to liquidity position of TVS Motor.
Analysis: The value of t was the -4.633 at df was 12 with a significance level was the 0.001, hence it can be concluded that the proposed null hypothesis was rejected and alternative hypothesis was accepted and confirmed that there was a significant difference between the liquidity position of Hero Motor Corporation to liquidity position of TVS Motor.
5.2 HYPOTHESIS 2
Null Hypothesis (H0): There is no significant difference between liquidity positions of Ashok Leyland to liquidity position of the Tata Motors Company.
Alternative Hypothesis (Ha): There is a significant difference between liquidity positions of Ashok Leyland to liquidity position of the Tata Motors Company.
Analysis: The calculated value of t was the 6.945 at degree of freedom was 12 and the level of significance was the 0.000, hence it can be concluded that the proposed null hypothesis was rejected and alternative hypothesis was accepted and confirmed that there was a significant difference between the liquidity position of Ashok Leyland to liquidity position of Tata Motors Company.
5.3 HYPOTHESIS 3
Null Hypothesis (H0): There is no significant difference between liquidity positions of Mahindra & Mahindra with the liquidity position of the Maruti Suzuki.
Alternative Hypothesis (Ha): There is a significant difference between liquidity positions of Mahindra & Mahindra with the liquidity position of the Maruti Suzuki.
Analysis: The value of t was -3.192 at 95 percent interval of the difference with degree of freedom was 12 and significance level was the 0.008, hence it can be concluded that the proposed null hypothesis was rejected and alternative hypothesis was accepted and came to knew that there was a significant difference between the liquidity position of Mahindra & Mahindra to liquidity position of the Maruti Suzuki.
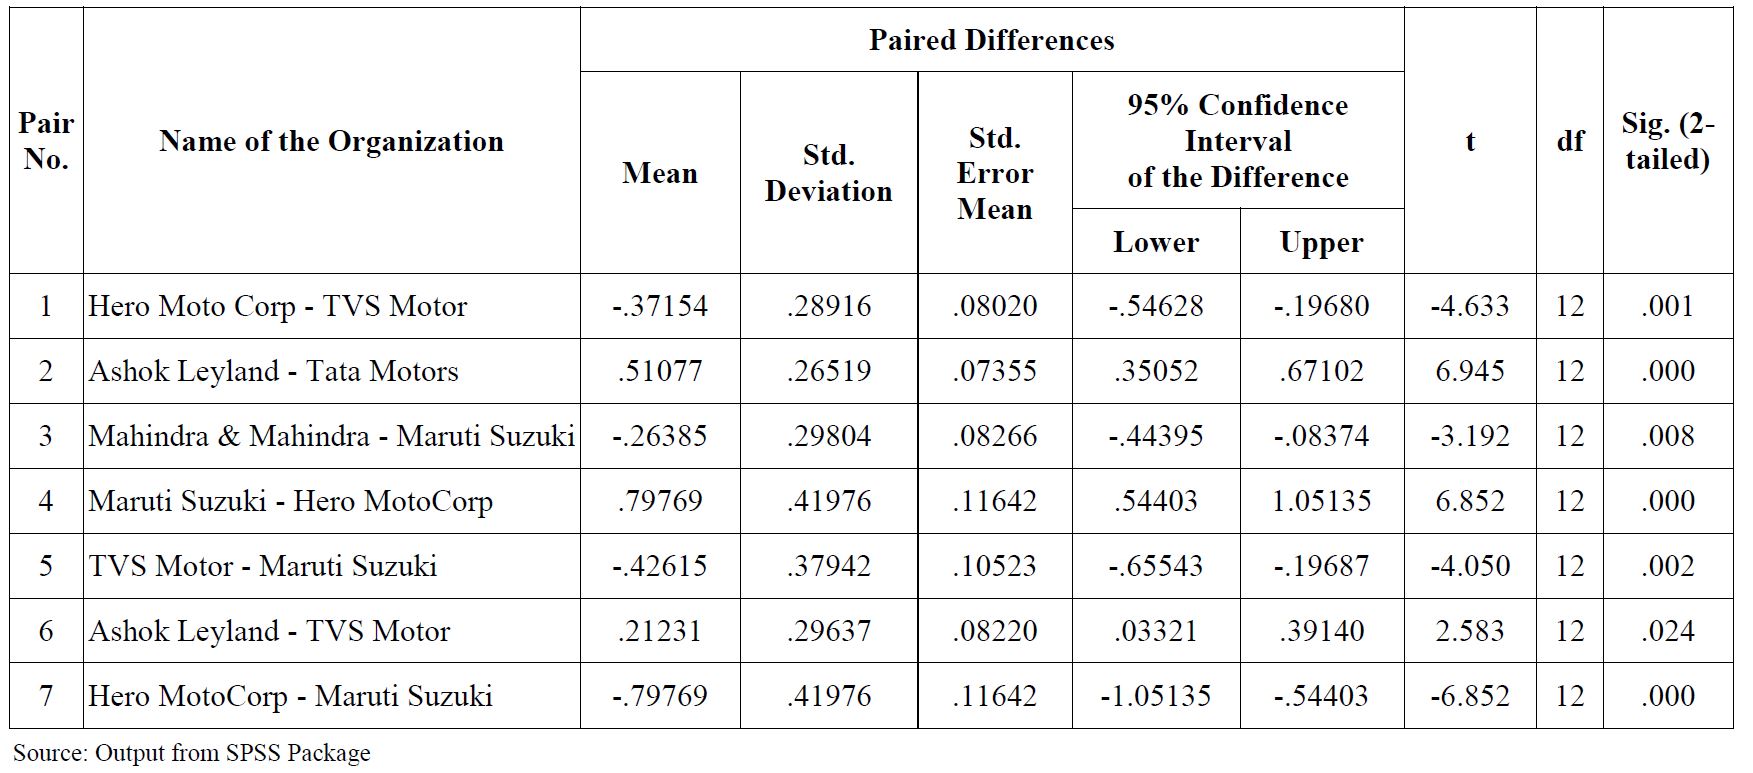
Table.4. Paired Samples Test of Correlations of Current Ratio of Different Firms with in a Auto-Mobile Industry from the Year 2002-03 to 2014-15
5.4 HYPOTHESIS 4
Null Hypothesis (H0): There is no significant difference between liquidity positions of the Maruti Suzuki to the liquidity position of the Hero Motor Corporation.
Alternative Hypothesis (Ha): There is a significant difference between liquidity positions of the Maruti Suzuki to the liquidity position of the Hero Motor Corporation.
Analysis: The value of t was 6.852 with 95 per cent confidence interval of the lower difference was the 0.54403 and upper difference was the 1.05135 with a df was the 12 with a significance level of 0.000, hence it can be concluded that the proposed null hypothesis was rejected and alternative hypothesis was accepted and came to know concluded that there was a significant difference between the liquidity position of the Maruti Suzuki to the liquidity position of the Hero Motor Corporation.
5.5 HYPOTHESIS 5
Null Hypothesis (H0): There is no significant difference between liquidity positions of the TVS Motor to the liquidity position of the Maruti Suzuki.
Alternative Hypothesis (Ha): There is a significant difference between liquidity positions of the TVS Motor to the liquidity position of the Maruti Suzuki.
Analysis: The value of t was the -4.050 at 95 per cent confidence interval with lower difference was the -0.65543 and upper difference was the -0.19687 with a degree of freedom was the 12 with a level of significance was 0.002, hence it can be concluded that the proposed null hypothesis was not accepted and alternative hypothesis was accepted and confirmed that there was a significant difference between the liquidity position of the TVS Motor Company to the liquidity position of the Maruti Suzuki Company.
5.6 HYPOTHESIS 6
Null Hypothesis (H0): There is no significant difference between liquidity positions of the Ashok Leyland to the liquidity position of the TVS Motor Company.
Alternative Hypothesis (Ha): There is a significant difference between liquidity positions of the Ashok Leyland to the liquidity position of the TVS Motor Company.
Analysis: The value of t was the 2.583 with a mean of 0.21231and has a 95 per cent confidence interval of the difference with a lower difference was the 0.3321 and with a upper difference was the 0.39140 and the value of t was the 2.583 with a degree of freedom was the 12 and having a level of significance was the 0.024, hence it can be concluded that the proposed null hypothesis was rejected and the alternative hypothesis was accepted and came to knew that there was a significant difference between the liquidity position of the Ashok Leyland to the liquidity of position of the TVS Motor.
5.7 HYPOTHESIS 7
Null Hypothesis (H0): There is no significant difference between liquidity positions of the Hero Motor Corporation to the liquidity position of the Maruti Suzuki.
Alternative Hypothesis (Ha): There is a significant difference between liquidity positions of the Hero Motor Corporation to the liquidity position of the Maruti Suzuki.
Analysis: The value of mean with-0.79769 with a standard deviation of the 0.41976 at 95 per cent confidence interval with a lower difference of -1.05135 and with higher difference of -0.54403 at the value of t was the -6.852 with a degree of freedom was the 12 and the level of significance was the 0.000 and confirmed that proposed null hypothesis was rejected and the alternative hypothesis was accepted and finally came to concluded that there was a significant difference between the liquidity position of the Hero Motor Corporation to the liquidity of position of the Maruti Suzuki.
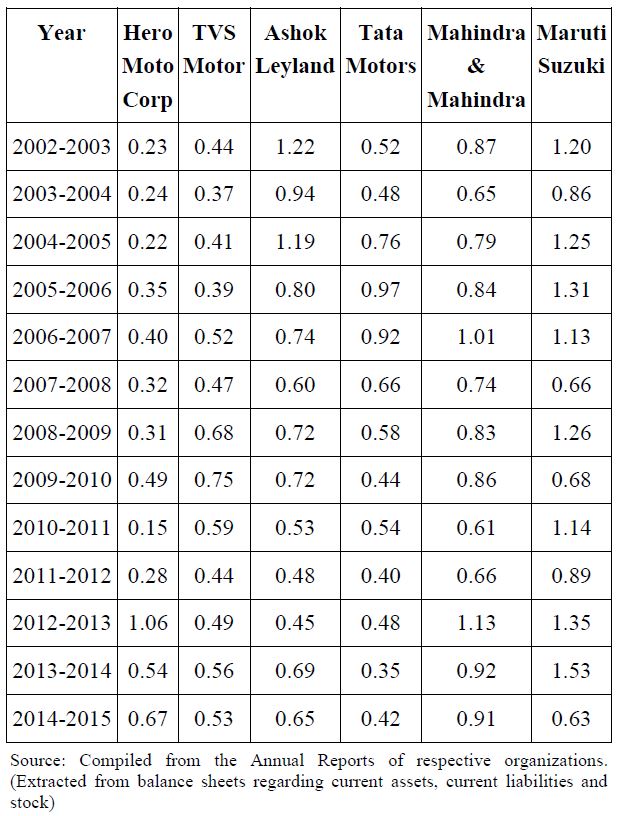
Table.5. Quick Assets Ratio of Different Firms with in an Auto-Mobile Industry from the Year 2002-03 to 2011-12
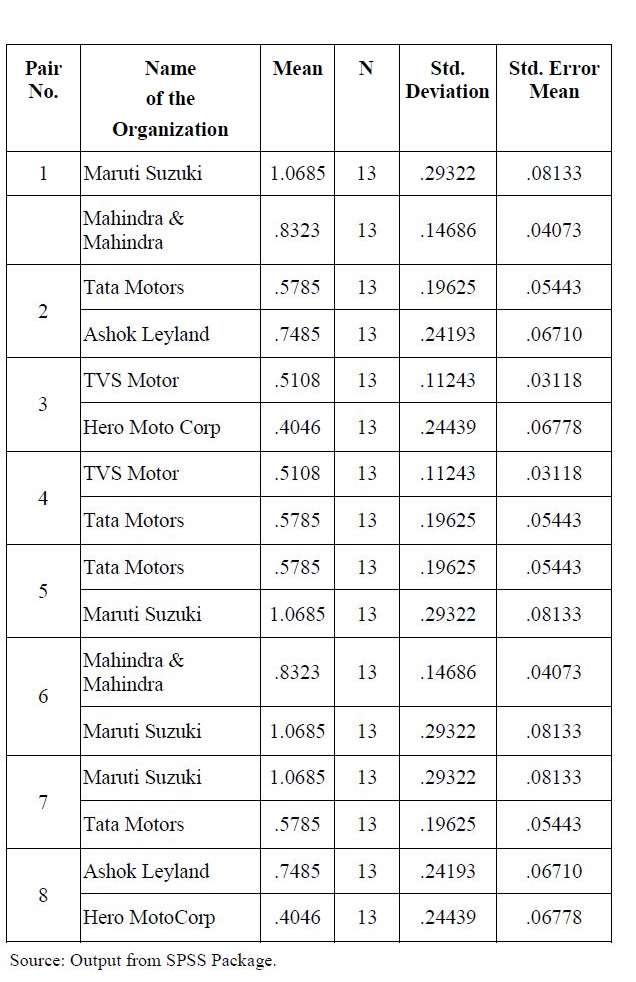
Table.6. Paired Samples Statistics of Quick Ratio of Different Firms with in an Auto-Mobile Industry from the Year 2002-03 to 2014-15
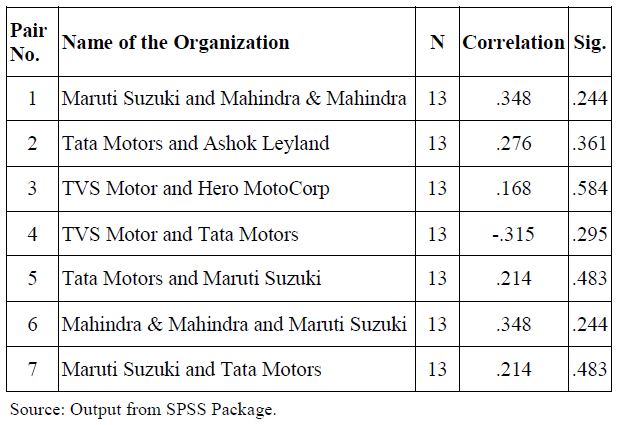
Table.7. Paired Samples Correlation of Quick Ratio of Different Firms with in an Auto-Mobile Industry from the Year 2002-03 to 2014-15
The Table.7 reveals the relationship between the two variables within a pair. The pair of TVS Motors and Tata Motors as well as the Ashok Leyland and Hero Motor Corporation was negatively correlated with weak relationship, but the other variables have a positively related and they had witnessed not having the strong relationship between the variables within a pair.
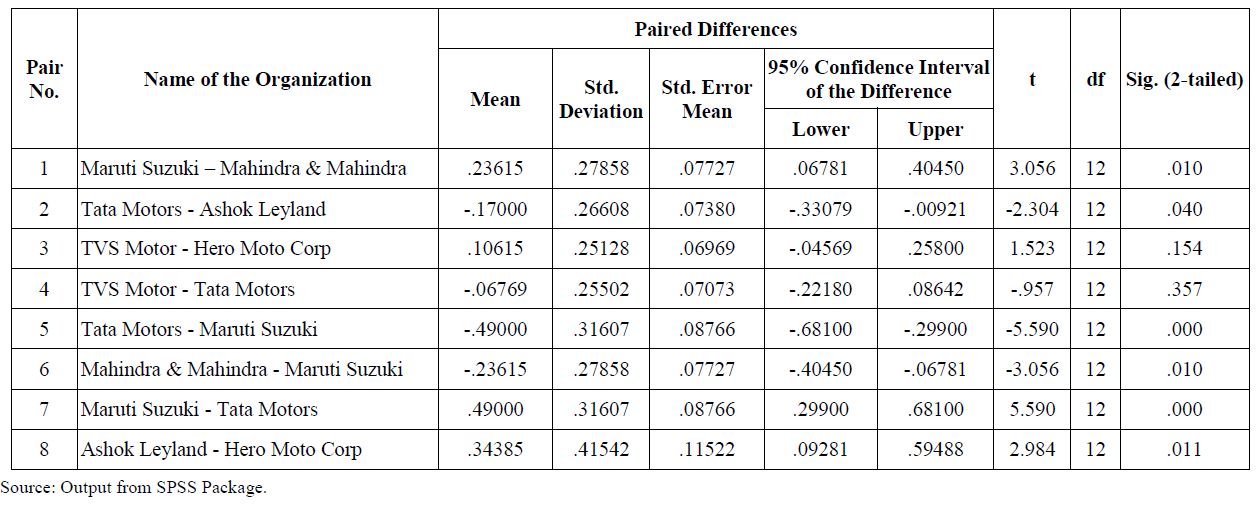
Table.8. Paired Samples Correlation of Quick Ratio of Different Firms with in an Auto-Mobile Industry from the Year 2002-03 to 2014-15
The Table.8 discloses the information regarding to test whether there is any significant difference between each other in a set of pair.
5.8 HYPOTHESIS 8
Null Hypothesis (H0): There is no significant difference between the quick assets ratio of Maruti Suzuki Company to the quick assets ratio of the Mahindra & Mahindra.
Alternative Hypothesis (Ha): There is a significant difference between the quick assets ratio of Maruti Suzuki Company to the quick assets ratio of the Mahindra & Mahindra.
Analysis: The value of t was the 3.056 at 95 percent confidence interval of the lower difference was 0.06781 and upper difference was the 0.40450 at degree of freedom was the 12 with level of significance was the 0.010, hence it can be concluded that the proposed null hypothesis was rejected and the alternative hypothesis was accepted and came to knew that there was a significant difference between the quick ratio of Maruti Suzuki to the quick ratio of Mahindra & Mahindra.
5.9 HYPOTHESIS 9
Null Hypothesis (H0): There is no significant difference between the quick ratios of Tata Motors Company to the quick ratio of Ashok Leyland.
Alternative Hypothesis (Ha): There is a significant difference between the quick ratios of Tata Motors Company to the quick ratio of Ashok Leyland.
Analysis: The value of t was the -2.304 with a 95 percent confidence interval of the difference of lower difference was -0.33079 with higher difference was the 0.00921 at degree of freedom was the 12 with level of significance was the 0.040, and came to concluded that the proposed null hypothesis was rejected and the alternative hypothesis was accepted and confirmed that there was a significant difference between the quick ratio of Tata Motors Company to the quick ratio of Ashok Leyland.
5.10 HYPOTHESIS 10
Null Hypothesis (H0): There is no significant difference between the quick ratios of TVS Motor Company to the quick ratio of Hero Motor Corporation.
Alternative Hypothesis (Ha): There is a significant difference between the quick ratios of TVS Motor Company to the quick ratio of Hero Motor Corporation.
Analysis: The value of t was the 1.523 at 95 percent confidence interval with a lower difference of -0.04569 and with a higher difference of 0.25800 at degree of freedom was the 12 with a level of significance was the 0.154, hence it can be concluded that the proposed null hypothesis was accepted and the alternative hypothesis was rejected and inferred that there was no significant difference between the quick ratio of TVS Motor Company to the quick ratio of Hero Motor Corporation.
5.11 HYPOTHESIS-11
Null Hypothesis (H0): There is no significant difference between the quick ratios of TVS Motor Company to the quick ratio of Tata Motors Company.
Alternative Hypothesis (Ha): There is a significant difference between the quick ratios of TVS Motor to the quick ratio of Tata Motors Company.
Analysis: The value of t was the -0.957 at 95 percent confidence interval of difference of lower -0.22180 with a upper 0.8642 at degree of freedom was the 12 with a level of significance was the 0.357, hence it can be concluded that the proposed null hypothesis was rejected and the alternative hypothesis was considered and concluded that there was no significant difference between the quick ratio of TVS Motor to the quick ratio of Tata Motors Company.
5.12 HYPOTHESIS 12
Null Hypothesis (H0): There is no significant difference between the quick ratios of Tata Motors Company to the quick ratio of Maruti Suzuki Company.
Alternative Hypothesis (Ha): There is a significant difference between the quick ratios of Tata Motors Company to the quick ratio of Maruti Suzuki Company.
Analysis: The value of t was the -5.590 with a 95 percent confidence interval with a lower difference of -0.68100, upper difference of -0.29900 with a degree of freedom of 12 with a level of significance was the 0.000, hence it can be concluded that the proposed null hypothesis was rejected and the alternative hypothesis was accepted and confirmed that there was a significant difference between the quick ratio of Tata Motors Company to the quick ratio of the Maruti Suzuki Company.
5.13 HYPOTHESIS-13
Null Hypothesis (H0): There is no significant difference between the quick ratios of the Mahindra & Mahindra to the quick ratio of Maruti Suzuki.
Alternative Hypothesis (Ha): There is a significant difference between the quick ratios of Mahindra & Mahindra to the quick ratio of Maruti Suzuki.
Analysis: The value of t was the -3.056 at degree of freedom was the 12, with a level of significance was the 0.01, hence it can be concluded that the proposed null hypothesis was rejected and the alternative hypothesis was accepted and confirmed that there was a significant difference between the quick ratio of the Mahindra & Mahindra to the quick ratio of the Maruti Suzuki.
5.14 HYPOTHESIS-14
Null Hypothesis (H0): There is no significant difference between the quick ratios of the Maruti Suzuki to the quick ratio of Tata Motors Company.
Alternative Hypothesis (Ha): There is a significant difference between the quick ratios of Maruti Suzuki to the quick ratio of the Tata Motors Company.
Analysis: The value of t was the 5.590 with 95percent confidence interval of difference with a lower value was the 0.29900, upper difference was the 0.68100 with a df was 12 and the level of significance was the 0.000, hence it can be concluded that the proposed null hypothesis was rejected and the alternative hypothesis was accepted and confirmed that there was a significant difference between the quick ratio of the Maruti Suzuki to the quick ratio of the Tata Motors Company.
5.15 HYPOTHESIS-15
Null Hypothesis (H0): There is no significant difference between the quick ratios of the Ashok Leyland to the quick ratio of the Hero Motor Corporation.
Alternative Hypothesis (Ha): There is a significant difference between the quick ratios of Ashok Leyland to the quick ratio of the Hero Motor Corporation.
Analysis: The value of mean with 0.34385 at 95 percent confidence interval of the lower difference was the 0.9281 with a higher difference of 0.59488 with a t value was the 2.984 at degree of freedom was the 12, with a level of significance was the 0.011, hence it can be concluded that the proposed null hypothesis was rejected and the alternative hypothesis was accepted and came to knew that there was a significant difference between the quick ratio of the Ashok Leyland to the quick ratio of the Hero Motor Corporation.
6. FINDINGS OF THE STUDY
The study pointed out that the following findings.
- 1. The higher liquidity position (current ratio) possessed by the Maruti Suzuki followed by the Ashok Leyland, Mahindra & Mahindra, TVS Motor, Tata Motors and Hero Motor Corporation.
- 2. There was positive relationship established regarding Hero Motor Corporation and TVS Motor, Ashok Leyland and Tata Motors and Mahindra & Mahindra to Maruti Suzuki.
- 3. The study also found that some of the pairs were negatively correlated with TVS Motor and Maruti Suzuki, Ashok Leyland and TVS Motor and the study also identified that there was a significant difference between from one variable to another variable within a pair of all pairs.
- 4. The study also observed that all the pairs positively correlated except in the two cases TVS Motor and Tata Motors and Ashok Leyland and Hero Motor Corporation.
- 5. The study also observed that there was a statistically significant difference from the Maruti Suzuki to the Mahindra & Mahindra, Tata Motors to Maruti Suzuki, Maruti Suzuki to Tata Motors and from Ashok Leyland to Hero Motor Corporation, but in a few cases there was no statistically significant difference from the TVS Motor to Tata Motors and TVS Motor and Hero Moto Corp.
7. CONCLUSION AND SUGGESTIONS
Finally it can be concluded that there was a statistically significance difference regarding the current ratio and quick ratio which are refers to the liquidity position and also it is suggested that every organization increase in collection of amount from the debtors, do not utilize the working capital funds for purchase of capital goods, establish the planned production schedules to avoid the excessive stocks of finished goods, do not engage in overtrading, manage the cash effectively, reduce the operating cycle, increase the speed of stock turnover by increasing revenue of sales or reducing the level of stocks being carried. The firm can delay in paying its creditors, postponement of some capital expenditure items which are not urgent, chasing up slow paying debtors; generate the reports for internal appraisal of the customer regarding collection of amount. It is also suggested that the organizations should maintain the optimum liquidity position to earn a maximum return; even through the existing liquidity position was satisfactory.
REFERENCES
[1] Abdul Raheman and Mohamed Nasr, “Working Capital Management and Profitability-Case of Pakistani Firms”, International Review of Business Research Papers, Vol. 3, No. 1, pp. 279-300, 2007.
[2] Amarjit Gill, “Factors that Influence Working Capital Requirements in Canada”, Economics and Finance Review, Vol. 1, No. 3, pp. 30-40, 2011.
[3] O.N. Arunkumar and T. Radharamanan, “Working Capital Management and Profitability: An Empirical Analysis of Indian Manufacturing Firms”, International Journal of Management, Vol. 4, No. 1, pp. 121-129, 2013.
[4] Mohammad Fawzi Shubita, “Working Capital Management and Profitability: A Case of Industrial Jordanian Companies”, International Journal of Business and Social Science, Vol. 4, No. 8, pp. 108-115, 2013.
[5] V. Sarangarajan, A. Ananth and S.A. Lourthuraj, “Financial Performance Efficiency of Select Cement Companies in Tamil Nadu”, International Journal of Advanced Research in Management, Vol. 4, No. 1, pp. 34-44, 2013.
[6] V. Sarangarajan, S.A. Lourthuraj and A. Ananth, “Capital Structure Efficiency of Cement Industry in Tamil Nadu”, International Journal of Management, Vol. 4, No. 1, pp. 190-196, 2013
[7] Hamid Bashir and Waqar Ahmad, “Does Efficient Working Capital Management Enhance Profitability of Pakistani Firms?”, Management and Administrative Sciences Review, Vol. 2, No. 6, pp. 715-720, 2013.
[8] James C. Van Horne, “A Risk-Return Analysis of a firm’s Working Capital Position”, The Engineering Economist: A Journal Devoted to the Problems of Capital Investment, Vol. 14, No. 2, pp. 50-58, 1969.
[9] Zahra Mousavi and Azam Jari, “The Relationship between Working Capital Management and Firm Performance: Evidence from Iran”, International Journal of Humanities and Social Science, Vol. 2, No. 2, pp. 141-146, 2012.