ICTACT Journal on Management Studies
Volume 2, Issue 1 - February 2016
RELATIONSHIP BETWEEN BRAND PREFERENCE AND CUSTOMER DEMOGRAPHIC PROFILE: A STUDY OF TELECOM SECTOR
Pankaj Jain
Amity Business School, Amity University Rajasthan, India
DOI: 10.21917/ijms.2016.0034
Abstract :
Understanding brand preferences of consumers has always been an area of great interest for brand researchers and marketers. This study has been undertaken to explore the relationship between the demographic variables and brand preferences of consumers for different telecom services of BSNL and RCOM. This research is descriptive and quantitative in nature. For the purpose of this study, a non-random sampling technique - convenient sampling method was used to select the sample. Total 422 consumers’ data was collected from four different cities in western Uttar Pradesh. Out of which 400 questionnaires were considered fit for data analysis. PASW.18 was used for the purpose of data analysis. The study finds that demographic variables have association with the consumer brand preference for various telecom services offered by BSNL and RCOM.
Keywords:
Brand Preference, Demographic Variables Telecom Services
1. INTRODUCTION
In modern marketing world, Brand equity is considered as an important asset of a company. Branding strategy is of great importance in total marketing strategy and companies must decide in advance whether to brand or not to brand. A product without brand name lacks its identity in the market. Today, branding has become inevitable and hardly anything goes unbranded. A brand is essentially a seller’s promise to provide a specific set of features, benefits and services to the buyers. A brand contains six ingredients namely attributes, benefits, values, culture, personality and consumer's characteristics. The American Marketing Association (AMA) defines brand as “a name, term, sign, symbol, or design, or a combination of them, intended to identify the goods and services of one seller or group of sellers and to differentiate them from those of competitors” [1]. Traditionally brand was defined as: “the name, associated with one or more items in the product line, which is used to identify the source of character of the item(s)” [2]. A brand thus signals to the customer the source of the product, and protects both the customer and the producer from competitors who would attempt to provide products that appear to be identical [3]. From the customer’s point of view, a brand can be defined as the total accumulation of all experiences, and is built at all points of contact with the customer [4]. Keller mentions, “Technically speaking, whenever a marketer creates a new name, logo, or symbol for a new product, he or she has created a brand” [5]. Nevertheless, he reckons that today brands serve much more than that. In this way, it can be said that one of the major function of brand is to distinguish identification in the market place vis-a-vis to competitors. De Chernatony & MacDonald emphasize the increased value that accrues to the consumer by buying the established brand rather than a generic or commodity product [6].
Understanding brand preferences of consumers has always been an area of great interest for brand researchers and marketers. Horsky et al. emphasize on understanding brand preference in order to better understand the brand choices made by customers [7]. Overby and Lee define brand preference favorable inclination towards a particular brand [8]. Similarly, many other researchers have also defined brand preferences as the behavioral dispositions that reflect the degree to which customer favor one brand over another [9]-[10]. Dhar observe that brand preference also reflects consumer brand evaluations while choosing a brand from various other competing brands available in the market [11]. Brand preference can predict consumer buying intention and consumer decisions for a product category better than brand attitude [12]-[13]. There are many studies measuring the impact of brand preference on consumer buying decision and intentions. However, there are few studies focusing on exploring the antecedents brand preferences [14]-[15]. Therefore this study has been undertaken to explore the relationship between the demographic variables and brand preferences of consumers for different telecom services. The study aims to achieve following objectives:
- To examine the association between selected demographicvariables and brand preference for selected telecomservices of BSNL & RCOM
- To examine the association between selected demographicvariables and preference payment mode
2. LITERATURE REVIEW
“Preference” has been a subject matter of interest for researchers in different areas such as economics [16]; psychology [17] and sociology [18]. However, there has been no consensus on its definition among researchers. Many researcher view preference as stable, exogenous, known with adequate precision and are revealed through choice behavior [19]. However, other researchers opine that one’s preferences are not stable [17] and can be endogenous as well [16]. From the marketing perspective, Oliver & Swan define preference as ability to be chosen among available options [20]. Zajonc & Markus suggest that “a preference is a behavioral tendency that exhibits itself not so much in what the individual thinks or says about the object, but how he acts toward it” [9]. Further, there are two marketing perspectives on how preferences are formed. The first view is that consumers have well-defined preferences and it is associated with the archaeology uncovering hidden value. The second view is that preferences are constructed by consumers when they evaluated available options for meeting their specific needs [21]. Payne et al. shows that dynamic interaction between decision task factors and properties of information processing system shape individual preferences [21]. However, this view has been criticized by Simonson who argues that this perspective does not cover the pre-existing preferences that are not determined by the task or context factors. He observes that this view of preference construction emphasizes only on the process of consumers’ judgment and completely ignores the preexisting factors playing an important role in determining preferences [22].
The factors that influence brand preference can be divided into two broad categories: brand oriented factors; and consumer oriented factors. Brand preference arises from the value added by the brand. The brand value can arise from brand related attributes (ex: brand equity) and non-brand related attributes (ex: price). Erden & Swait highlight the impact of brand equity in positively influencing the customer brand preferences [23]. The importance of brand equity in influencing the brand preference has been highlighted by many researchers [23]-[25]. Cobb-Walgren et al. focus on assessing how brand equity affects the consumer brand preference at the aggregate level [26]. The impact of brand personality on consumer brand preference has also been studied by many researchers [27]. Other studies have focused on non-brand attributes as well such as impact of appearance [28]; price [29], and self-congruity [30]-[32]. Further, the influence of promotional activities has also been studied by many researchers in influencing consumer brand preference. Conflicting results have been reported on the influence of promotional activities on consumer brand preference. Many studies demonstrate that advertising affect consumer preference indirectly by directly influencing attitude towards brand attributes [33]; or by generating better brand awareness [34]-[35] or by increasing brand equity [26]. Davis et al. report that advertising does not influence consumer brand preference negatively [36]. Further, support for positive role of advertising in directly influencing consumer brand preference has also not been found in previous studies [35]. Doyle also opines that there is no direct influence that advertising has on consumer brand preference. Many brands have strong consumer brand preference despite spending very less or nothing on advertising.
Consumer characteristics also influence preference for certain brand. These characteristics can be divided into socio-cultural, psychological and personal categories. Among all variables under these categories, “self-concept” has been found most important in influencing brand preference of consumers by many research studies [38]-[39]. Research studies have also found the impact of life style on consumer brand preferences [40]. Similarly, many studies have found that consumer demographic variable influence their brand preferences [41]. Many demographic variables have been reported to have an influence on consumer brand preference [42]. Perez et al. demonstrate that brand preference is transferred from one generation to another as children learn from their parents [43]. This finding is in contradiction with those who claim that consumer preferences are heterogeneous [7] because consumers have different characteristics and would prefer different brand that would best fit their characteristics [44].
3. RESEARCH METHODOLOGY
This research is descriptive and quantitative in nature. A quantitative approach saves time and money as once the questionnaire is prepared, it can be administered on chosen sample with relatively lesser time as compared to qualitative research methods. Descriptive research studies require some previous understanding pertaining to research problem and are fit for answering questions of who, what, how, where, when [45]. Collis & Hussey stated that quantitative methods are suitable for hypothesis testing purpose [46]. Primary data have been collected from a structured questionnaire. Total 422 consumers’ data was collected from four different cities in western Uttar Pradesh. For the purpose of this study, a non-random sampling technique - convenient sampling method was used to select the sample. Zikmund defined non random sampling technique where sample is drawn from population based on judgment or convenience [45].
Convenient sampling technique makes it possible to get sufficiently large number of responses quickly and economically [47]. Fink also supported the use of convenient sampling method on the ground of availability of respondents when required [47]. Though there are also limitations of convenient sampling methods as it may not give a true representative sample, bias and variability are hard to estimate or control [45]. Still this sampling technique was used considering ease of access, paucity of time to interact with employees, higher response rate. A total of 422 individuals responded to the questionnaire designed for consumers out of which 400 questionnaires were considered fit for data analysis. PASW.18 was used for the purpose of data analysis. Data was analyzed at univariate and bivariate level. First of all data normality was ensured. For the purpose Histogram and Kolmogorov–Smirnov test was used to ensure that data normality [45]. Percentage analysis was done for analyzing the profile of respondents. Further, to test the associations between variables chi-square test was used.
4. FINDINGS AND ANALYSIS
4.1 PROFILE OF RESPONDENTS
The distribution of respondents in age groups was as follows: Less than 18 years (13%); 18-23 years (25%), 24-28 years (28%); 29-45 years (23%); and above 45 years (13%). Further, occupation wise there were 20% government service employees; 28% private service employees; 20% businessman or self-employed; 18% students and remaining 15% homemakers. The majority of the respondents (55%) were male; the remaining (45%) respondents were female. In income groups, 30% of respondents were less than 2.5 lakh/- per annum; 20% were between 2.5 lakh to 5 lakh per annum; 30% were between 5 lakh to 10 lakh per annum; remaining 20% were above 10 lakh per annum.
4.2 BRAND PREFERENCE FOR WLL
Brand preferences for the product Wireless Local Loop (WLL) and demographic differences have been shown in Table.1. Overall respondents showed preference for RCOM’s WLL (57%) to BSNL’s WLL (43%). The chi-square test for independence is a test of whether two categorical variables are associated with each other. By using chi square test association of demographic factors with brand preference was analyzed. The Table.1 indicates the obtained frequencies differ significantly across demographic factors as the asymptotic significance (2 - tailed) is less than 0.05 so demographic factors and brand preference for WLL are strongly associated with each other.
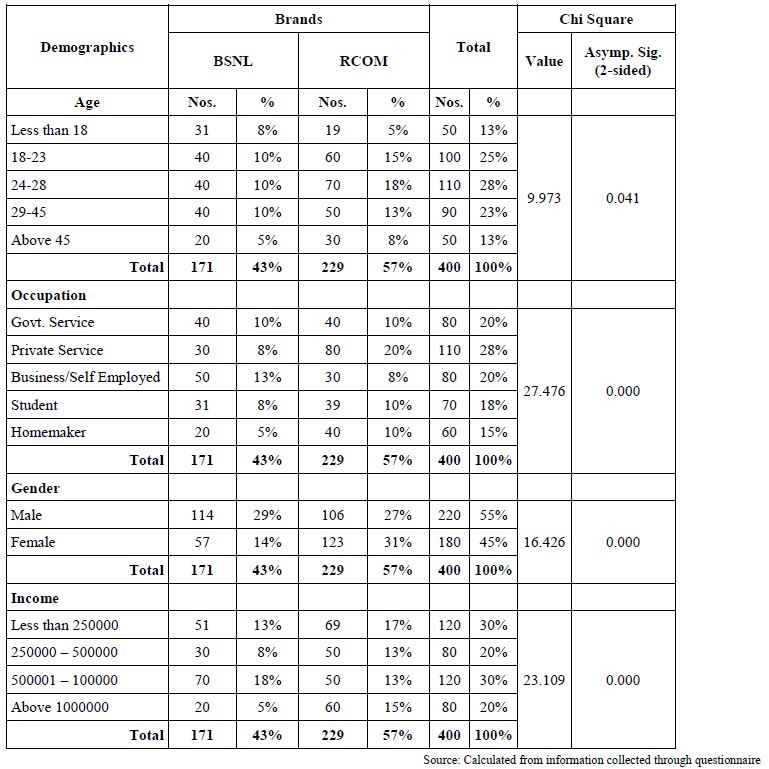
Table.1. Demographic Differences and Brand Preference Scores of BSNL and RCOM in Western U.P. for Wireless Local Loop (WLL)
4.3 BRAND PREFERENCE FOR FIXED LINE
Brand preferences for the product Fixed Line and demographic differences have been shown in Table.2. Overall respondents showed preference for BSNL’s fixed line (63%) to RCOM’s fixed line (37%). The Table.2 reveals that among the four demographical factors i.e. age, occupation, gender and income, only obtained frequencies for gender does not differ significantly. The asymptotic significance (2 - tailed) for gender is 0.338 which is more than 0.05, so the results indicate that brand preference for fixed line and gender are independent factors. Age, income and occupation are strongly related with brand preference for Fixed Line services provided by telecom service providers. Though majority of the respondents prefer BSNL fixed line to RCOM fixed line but this does not hold true for the respondents between 24 years to 28 years as 15% prefer RCOM’s fixed line and 13% prefer BSNL’s fixed line.
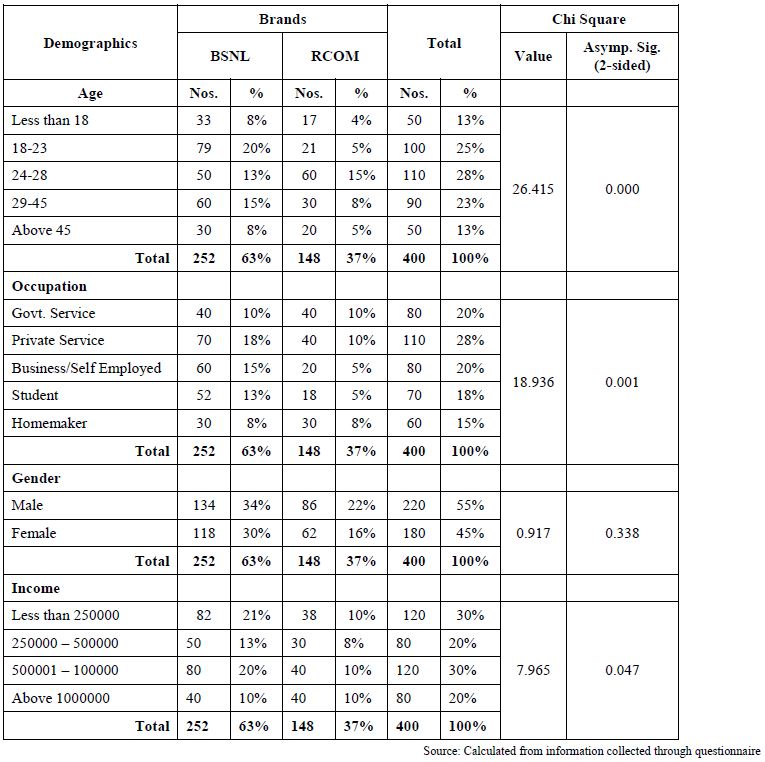
Table.2. Demographic Differences and Brand Preference Scores of BSNL and RCOM in Western U.P. for the product Fixed Line
4.4 BRAND PREFERENCE FOR MOBILE PHONE
Brand preferences for the product Mobile Phone and demographic differences have been shown in Table.3. Overall respondents showed preference for RCOM’s mobile services (60%) to BSNL’s mobile services (40%). The Table.3 indicates that among the four demographical factors i.e. age, occupation, gender and income, obtained frequencies for age and gender do not differ significantly. The asymptotic significance (2 - tailed) for age is 0.188 and for gender it is 0.151, both are more than 0.05, so the results indicate that brand preference for mobile phone services and two demographical variables i.e. age and gender are independent factors. Income and occupation are strongly related with brand preference for mobile phone services provided by telecom service providers. Though majority of the respondents prefer RCOM mobile services to BSNL mobile services but data reveals that more homemakers (10%) prefer BSNL mobile to RCOM mobile services (5%).
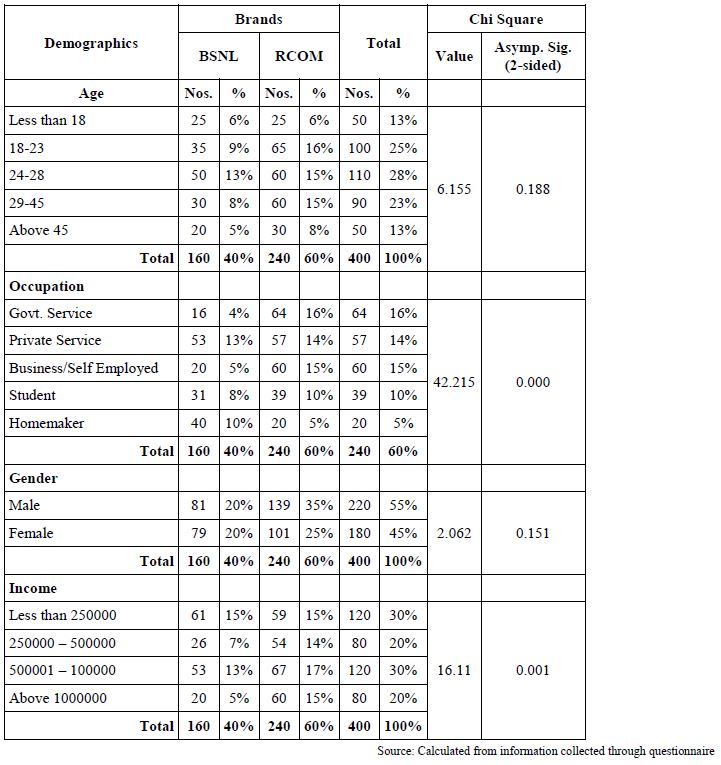
Table.3. Demographic Differences and Brand Preference Scores of BSNL and RCOM in Western U.P. for the product Mobile Services
4.5 BRAND PREFERENCE FOR DATA CARDS
Brand preferences for the product Data Cards and demographic differences have been shown in Table.4. Overall respondents showed preference for RCOM’s data cards (52%) to BSNL’s Data Cards (48%). The Table.4 discloses that observed frequencies are significantly different across demographic factors and asymptotic significance (2 - tailed) is less than 0.05 across all demographic factors. Therefore age, gender, occupation and income are closely associated to brand preference for data cards.
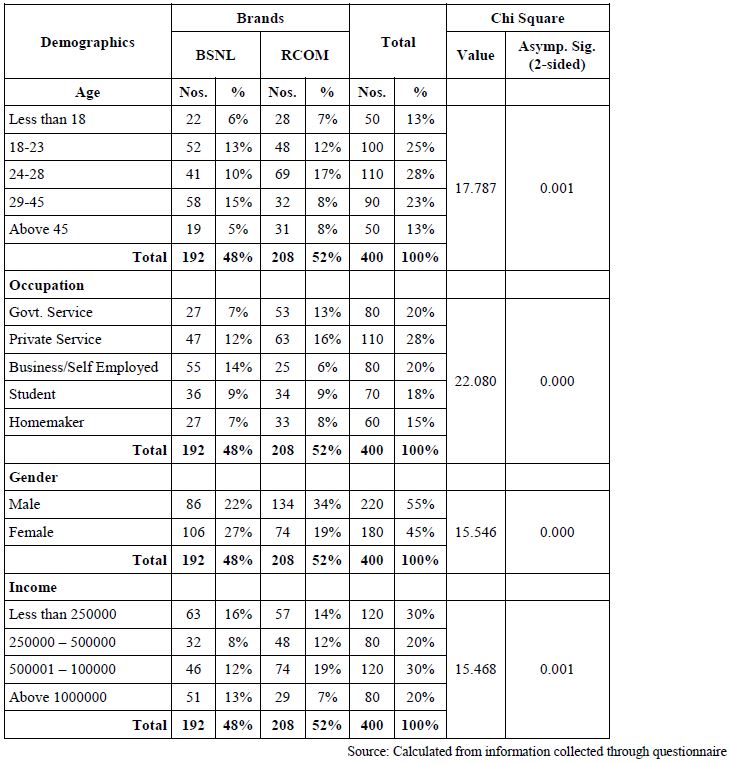
Table.4. Demographic Differences and Brand Preference Scores of BSNL and RCOM in Western U.P. for the product Data Card
4.6 PAYMENT MODE PREFERENCE
Preferences for payment modes, pre-paid & post-paid connections and demographic differences have been shown in the Table.5. Overall respondents showed preference for pre-paid (80%) to post-paid (20%). The Table.5 indicates that for income, age and gender there is no significant difference among the observed frequencies as asymptotic significance (2 - tailed) is more than .05. Therefore age, gender and income are not associated with payment mode preference whereas for occupation asymptotic significance (2 - tailed) is less than 0.05, hence occupation and preference for payment mode are closely related to each other.
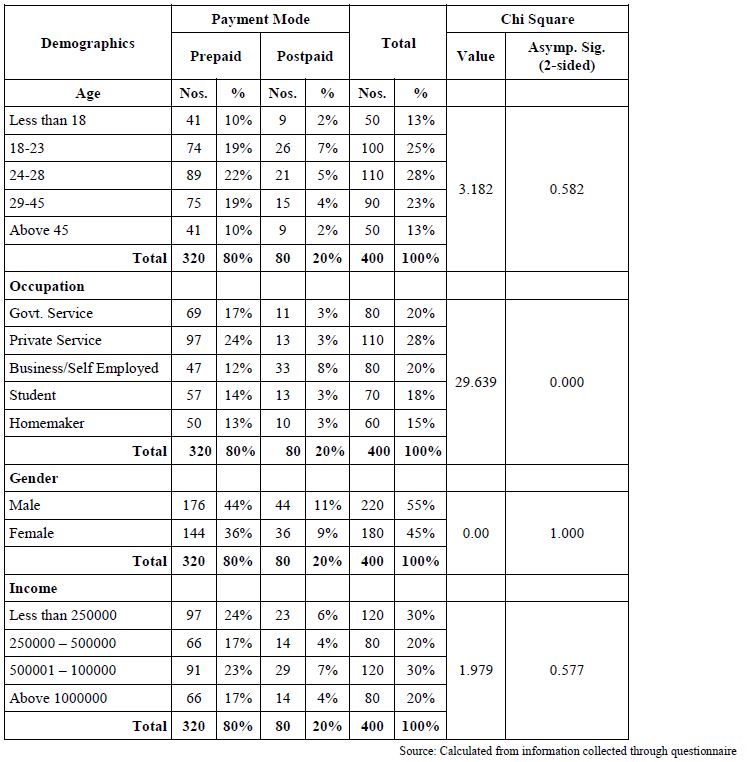
Table.5. Demographic Differences and Payment Mode Preference Scores for Pre-paid and Post-paid connections in Western UP
4.7 ANALYSIS OF PREFERENCES
On the basis of above analysis, following exhibit has been composed to find out the significant difference among the frequencies observed for various preferences. Preferences for brands, technology, payment mode and net connection have been shown in the Table.6. It indicates that for WLL, mobile and data cards, more respondents, 57%, 60% and 52% respectively, prefer RCOM brand while for fixed line, BSNL is preferred by 63% respondents. As regards to technology, payment mode and type of net connection, majority of respondents prefer GSM (61%) over CDMA, prepaid (80%) over postpaid and wired net connection (66%) over wireless net-connection. Chi-square test have been used to analyze if the differences in observed frequencies are significant. Asymptotic significance for products, technology, payment mode and type of net connection is less than .05; hence differences among observed frequencies are significant.
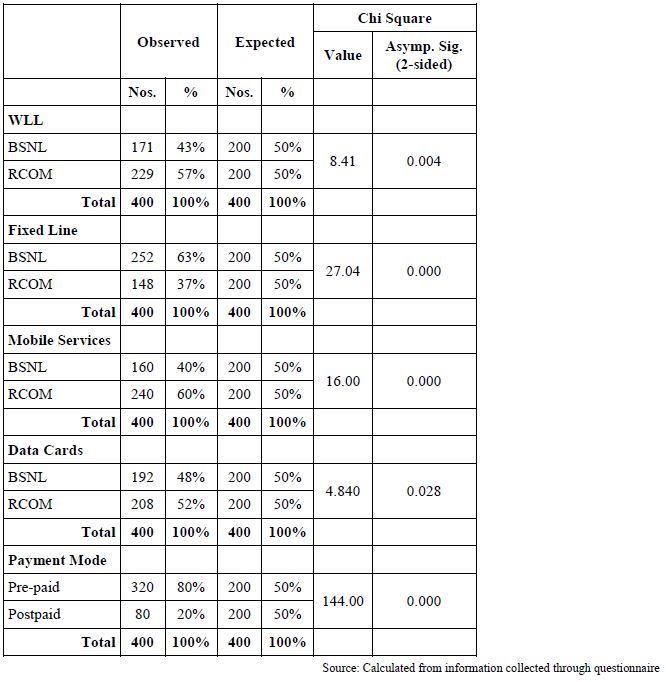
Table.6. Preference Scores for Brands, Technology, Payment Mode and Type of Net Connection in Western UP
5. CONCLUSION
This study examine the association between customer brand preference for various telecom services of BSNL and RCOM and selected demographic variables and conclude that there exist some association between demographic variables and their preferences for different types of telecom services. The study also found that except Fixed-Line telecom service, all retail telecom services of RCOM enjoy better brand preference than BSNL’s telecom services. Further, this study also concludes that pre-paid connection are more preferred to postpaid connections. Marketers of telecom services should keep in mind the need of different demographic segments and accordingly design their telecom packages so as to ensure the maximum satisfaction for customers.
REFERENCES
[1] Marketing Definitions: A Glossary of Marketing Terms, American Marketing Association, pp. 1-23, 1960
[2] Philip T. Kotler, “Marketing Management: Analysis, Planning, Implementation and Control”, 8th Edition, Prentice Hall, 2000.
[3] David A. Aaker, “Managing Brand Equity. Capitalizing on the Value of a Brand Name”, Journal of Marketing, Vol. 56, No. 2, pp. 125-128, 1992.
[4] Jean Noel Kapferer, “Strategic Brand Management: Creating and Sustaining Brand Equity Long Term”, 3rd Edition, Kogan Page, 2004.
[5] Kevin Lane Keller,“Brand synthesis: the multidimensionality of brand knowledge”, Journal of Consumer Research, Vol. 29, No. 4, pp. 595-600, 2003.
[6] Leslie de Chernatony and Malcolm McDonald, “Creating Poweful Brands”, 3rd Edition, Butterworth-Heinemann, 2003.
[7] Dan Horsky, Sanjog Misra and Paul Nelson, “Observed and Unobserved Preference Heterogeneity in Brand-Choice Models”, Marketing Science, Vol. 25, No. 4, pp. 322-335, 2006.
[8] Jeffrey W. Overby and Eun Ju Lee, “The Effect of Utilitarian and Hedonic Online Shopping Value on Consumer Preference and Intentions”, Journal of Business Research, Vol. 59, No. 10, pp. 1160-1166, 2006.
[9] Robert B. Zajonc and Hazel Markus, “Affective and Cognitive Factors in Preferences”, Journal of Consumer Research, Vol. 9, No. 2, pp. 123-131, 1982.
[10] Hellier, K. Phillip, Geursen, Gus M. Carr, A. Rodney and John A. Rickard, “Customer Repurchase Intention: A General Structural Equation Model”, European Journal of Marketing, Vol. 37, No. 11, pp. 1762-1800, 2003.
[11] Ravi Dhar and Nathan Novemsky, “Beyond Rationality: the Content of Preferences”, Journal of Consumer Psychology, Vol. 18, No. 3, pp. 175-178, 2008.
[12] Frank M. Bass and W. Wayne Talazyk, “An Attitude Model for the Study of Brand Preference”, Journal of Marketing Research, Vol. 9, No. 1, pp. 93-96, 1972.
[13] Richard P. Bagozzi “A Holistic Methodology for Modeling Consumer Response to Innovation”, Operations Research, Vol. 31, No. 1, pp. 128-176, 1983.
[14] Vishal .P. Singh, Karsten T. Hansen and Sachin Gupta, “Modeling Preferences for Common Attributes in Multi-Category Brand Choice”, Journal of Marketing Research, Vol. 42, No. 2, pp. 195-209, 2005.
[15] Ravi Dhar, Stephen M. Nowlis and Steven J. Sherman, “Comparison Effects on Preference Construction”, Journal of Consumer Research, Vol. 26, No. 3, pp. 293-306, 1999.
[16] Warren J Samuels, “Information Systems, Preferences, and the Economy in the JEI”, Journal of Economic Issues, Vol. 12, No. 1, pp. 23-41, 1978.
[17] Paul J Albanese, “The Nature of Preferences: An Exploration of the Relationship between Economics and Psychology”, Journal of Economic Psychology, Vol. 8, No. 1, pp.3-18, 1987.
[18] John F. Tomer, “Good habits and bad habits: A New Age Socio-Economic Model of Preference Formation”, Journal of Socio-Economics, Vol. 25, No. 6, pp. 619-638,1996.
[19] James G. March, “Bounded Rationality, Ambiguity, and the Engineering of Choice”, Journal of Economics, Vol. 9, No. 2, pp. 587-608, 1978.
[20] Richard L. Oliver and John E. Swan, “Consumer Perceptions of Interpersonal Equity and Satisfaction in Transactions: A Field Survey Approach”, Journal of Marketing, Vol. 53, No. 2, pp. 21-35, 1989.
[21] John W. Payne, James R. Bettman and David A. Schkade, “Measuring Constructed Preferences: Towards a Building Code”, Journal of Risk and Uncertainty, Vol. 19, No. 1-3, pp. 243-270, 1999.
[22] Itamar Simonson “Will I Like a “Medium” Pillow? Another Look at Constructed and Inherent Preferences”, Journal of Consumer Psychology, Vol. 18, No. 3, pp. 155-169, 2007.
[23] Tulin Erdem and Joffre Swait “Brand Equity as a Signaling Phenomenon”, Journal of Consumer Psychology, Vol. 7, No. 2, pp.131-157, 1998.
[24] Hsin Hsin Chang and Ya Ming Liu, “The Impact of Brand Equity on Brand Preference and Purchase Intentions in the Service Industries”, The Service Industries Journal, Vol. 29, No. 12, pp. 1687-1706, 2009.
[25] Ahmed H. Tolba and Salah S. Hassan, “Linking Customer-Based Brand Equity with Brand Market Performance: a Managerial Approach”, Journal of Product and Brand Management, Vol. 18, No. 5, pp. 356-366, 2009.
[26] Cathy J. Cobb Walgren, Cynthia A. Ruble and Naveen Donthu, “Brand Equity, Brand Preference, and Purchase Intent”, Journal of Advertising, Vol. 24, No. 3, pp. 26-40, 1995.
[27] Dohee Kim, Vicent P. Magnini and Manisha Singal, “The Effects of Customers’ Perceptions of Brand Personality in Causal Theme Restaurants”, International Journal of Hospitality Management, Vol. 30, No. 2, pp. 448-458, 2011.
[28] Marielle E. H. Creusen and P. L. Jan “The Different Roles of Product Appearance in Consumer Choice”, Journal of Product Innovation Management, Vol. 22, No. 1, pp. 63-81, 2005.
[29] Sangkil Moon and Glenn Voss, “How do price range shoppers differ from reference price point shoppers?, Journal of Business Research, Vol. 62, No. 1, pp. 31-38, 2009.
[30] Ahmad Jamal and Mohammed Al-Marri, “Exploring the Effect of Self-Image Congruence and Brand Preference on Satisfaction: the Role of Expertise”, Journal of Marketing Management, Vol. 23, No. 7-8, pp. 613-629, 2007.
[31] Russell J. Branaghan and Emily A. Hildebrand, “Brand Personality, Self-Congruity, and Preference: a Knowledge Structures Approach”, Journal of Consumer Behaviour, Vol. 10, No. 5, pp. 304-312, 2011.
[32] Jing Hu, Xin Liu, Zhilin Yang and Sijun Wang, “The Role of Brand Image Congruity in Chinese Consumers’ Brand Preference”, Journal of Product and Brand Management, Vol. 21, No. 1, pp. 26-34, 2012.
[33] Amitav Chakravarti and Chris Janiszewski “The Influence of Generic Advertising on Brand Preferences”, Journal of consumer research, Vol. 30, No. 4, pp. 487-502, 2004.
[34] A.G. Woodside and E.J. Wilson, “Effects of Consumer Awareness of Brand Advertising on Preference”, Journal of Advertising Research, Vol. 25, No. 4, pp. 41-48, 1985.
[35] Giles D'Souza and Ram C. Rao, “Can Repeating an Advertisement more Frequently than the Competition Affect Brand Preference in a Mature Market”, Journal of Marketing, Vol. 59, No. 2, pp. 32-42,1995.
[36] Scott Davis, J. Jeffrey Inman and Leigh McAlister, L. (1992). “Promotion has a Negative Effect on Brand Evaluations - or Does It? Additional Disconfirming Evidence”, Journal of Marketing Research, Vol. 29, No. 1, Vol. 143-148, 1992.
[37] Peter Doyle, “Building Successful Brands: the Strategic Options”, Journal of Consumer Marketing, Vol. 5, No. 1, pp.77-95, 1989.
[38] R. Eugene Hughes, “Self-Concept and Brand Preference: A Partial Replication”, The Journal of Business, Vol. 49, No. 4, pp. 530-540, 1976.
[39] Jae W. Hong and George M. Zinkhan, “Self-Concept and Advertising Effectiveness: The Influence of Congruency, Conspicuousness, and Response Mode”, Psychology and Marketing, Vol. 12, No. 1, pp. 53-77, 1995.
[40] Euehun Lee, George P. Moschis and Anil Mathur, “Stress, Coping and Consumer Preferences: A Two-WayTransitional Event History Analysis”, International Journal of Consumer Studies, Vol. 31, No. 4, pp. 428-435, 2007.
[41] Ahmad Jamal and Mark M. H. Goode, “Consumers and Brands: A Study of the Impact of Self-Image Congruence on Brand Preference and Satisfaction”, Marketing Intelligence and Planning, Vol. 19, No. 7, pp. 482-492, 2001.
[42] Margaret K. Hogg, Margaret Bruce and Alexander J. Hill, “Fashion Brand Preferences among Young Consumers”, International Journal of Retail and Distribution Management, Vol. 26, No. 8, pp. 293-300, 1998.
[43] Maria Eugenia Perez, Dan Padgett and Willem Burgers, “Intergenerational Influence on Brand Preferences”, Journal of Product and Brand Management, Vol. 20, No. 1, pp. 5-13, 2011.
[44] Bernd H. Schmitt and Clifford J. Shultz, “Situational Effects on Brand Preferences for Image Products”, Psychology and Marketing, Vol. 12, No. 5, pp. 433-446, 1995.
[45] William G. Zikmund, Barry J Babin, Jon C. Carr and Mitch Griffin,“Business Research Methods”, South-Western College Pub, 2010.
[46] Jill Collis and Roger Hussey, “Business Research: A Practical Guide for Undergraduate and Postgraduate Students”, 4th Edition, Palgrave Macmillan, 2003.
[47] Arlene Fink, “How to Conduct Surveys. A Step by Step Guide”, 4th Edition, Sage Publications, 2008.