ICTACT Journal on Management Studies
Volume 1, Issue 4 - November 2015
DRIVERS OF FINANCIAL PERFORMANCE OF SUGAR INDUSTRY IN INDIA
C.R. Rajan1 and N. Chandrasekaran2
1Great Lakes Institute of Management, India
2Jansons School of Management, India
DOI: 10.21917/ijms.2015.0026
Abstract : The sugar and sugarcane prices are highly regulated by the state governments of India. The objective of our study is to find reasons for sustainability of sugar mills despite poor economics. Through secondary research, the supply chain and key financial metrics of five selected sugar mills are analyzed. Correlation coefficient is computed for the crucial pairs of financial ratios (control variables). The results indicated that sugar industries are able to sustain by leveraging the profits from by-products and the industry is suffering from the government policies of pricing sugar and sugarcane. Arrears in payments to farmers by sugar millers could be a way to regulate the supply (cultivation) of sugarcane by the farmers in the catchment area of their mills. It is also observed that volume of production increase does not drastically reduce the margin as it is widely believed among industry circles. Similarly, accounts payable is not a larger issue with millers whereas cane arrears could be an issue with farmers. The study emphasises the need for financial analysts closely monitoring volume, productivity, margin and payables. The study uses simple framework and tools for establishing a meaningful relationship among operating and financial parameters of the industry.
Keywords: Sugar Industry, Financial Ratio Analysis, Cyclic Trends, Profitability, Productivity Analysis1. INTRODUCTION
Indian sugar industry, a critical industry, serves the domestic market, the largest in the world and supports 50 million farmers and their families. But the supply chain of the conventional Sugar industry is characterized by hostile relations between different stake holders, which led to each developing their systems for their own benefit, without reference to the wider industry interests. The supply chain starts with the farmers who transport the cane as rapidly as possible to the sugar mill to maximise the content and quality of sugar produced. The juice extracted from the cane and is filtered, crystallised, refined and sent to the market for domestic consumption.
Energy is a key input this process and is typically met by using bagasse as fuel to generate heat and electricity. The surplus electricity is being exported to local electricity users/nearby industries. The residual molasses from the crystallisation process is used for producing alcohol in the mill owned distilleries/standalone distilleries, which is used as industrial solvent or in the manufacturing of beverages. Sugar is an essential commodity and the industry is regulated by government on sugarcane price, sugarcane procurement, sugar production and sale of sugar by mills in domestic and international markets.
2. LITERATURE REVIEW
According to KPMG Report on Indian Sugar Industry, India is the second largest sugar producing geography. The sector supports over 50 million farmers and their families, and delivers value addition at the farm side. Fuel ethanol and surplus power production through cogeneration are the by-products during the manufacture of sugar [1].
Globally energy security and environmental concerns are driving the adoption of fuelethanol across countries. Global ethanol exports, currently at 6.5 billion litres are expected to increase to 50 to 200 billion litres by 2020. This increase would largely depend on world crude prices and regulatory evolution. India also faces similar environmental concerns and an increasing energy demand and would need to consider developing fuel ethanol programmes with high levels of blending [2].
“India’s Sugar Industry: Analysing Domestic Demand and Recent Trends” report says that a 50% increase in oil prices between 2010 and 2030 would significantly reduce economic growth, real consumption and household income. Expansion of biodiesel and ethanol intervention can use to counteract the economic impacts of oil price hikes. Combining supply-side energy solutions, like biodiesel development, together with modest energy efficiency improvements and productivity improvements in agriculture will provide useful results [3].
According to Sunil Kumar and NitinArora, the dismal performance of sugar industry is the product of both internal and external environmental factors. The uncontrollable factors with respect to company’s management are external factors (like decreasing area under sugarcane cultivation, tight government regulations in pricing and distribution of sugar, rainfall deficit, etc.) and their effect is almost uniform on the overall performance of the industry. The internal factors that are controllable are e.g., low level of capacity utilization, inefficient use of inputs, labour unrest, and managerial underperformance. Through their study, an attempt had been made to analyse the effect of both internal and external factors on the growth performance of Indian sugar industry. The overall technical efficiency (OTE) score has been used as measurement of performance, which depends upon the internal sources of managerial (proxy by pure technical efficiency (PTE)) and scale efficiencies (SE) as well as external sources like profitability, availability of skilled manpower and capital intensity, etc. The availability of skilled labour and profitability were found to be most significant determinants of technical efficiency in Indian sugar industry. The methodology used by them was full cumulative data envelopment analysis (FCDEA) [4].
Murty et al. analyzed the impact of environmental regulation on productive efficiency and cost of pollution abatement for the sugar industry of India. The average environmental efficiency has been observed to be 0.85, which implied that the industry had to incur an input cost of 15% more to reduce pollution for a given level of production of good output [5].
Sarbapriya Ray et al. economic analysis on “Performance of Indian Sugar Industry: An Economic Analysis” result showed that there has been diminishing capacity utilization growth rate in the industry during post reform period. The impact of liberalization on economic capacity utilization of Indian sugar industry is noticed to have significant negative impact [2].
Adya Prasad Pandey et al., conclude that the main concern of sugar industry in India is fluctuations in sugarcane production due to inadequate irrigation facilities, lower sugarcane yield, and frequent droughts in tropical and sub-tropical areas where sugarcane is grown on a large scale. Sugar recovery is also lower in comparison with other sugar manufacturing countries. This leads to escalation of production costs and weakness competitive edge of the industry. Sugarcaneproduction in India has decelerated to a great extent due to water and power shortage, in recent years. Special attention is needed to be given on water resource management. The complete area under sugar cultivation should be brought under drip irrigation to conserve water as well as fertilizers. Uninterrupted power supply to sugarcane growers and sugar factories would increase production and productivity. To enhance share of Indian sugar industry in global level, quality and quantity of sugar needs to be enhanced [6].
P. Chellaswamy et al. in his study on Growth and Productivity of Indian Sugar Companies analysed 34 sugar manufacturing companies were included among 119 universal companies. The methodology adapted by using the tools like Annual compound growth rate, trend analysis by method of least squares and multiple regression analysis. The productivity ratios and the production function were computed by Solow model. The growth of the northern region had positive growth in terms of output, capital employed and also there is better rainfall and irrigation in this region than that of the southern region. The average growth of sugar industry was slower in the southern region than that of northern region due to poor irrigation and rainfall. He finds that there is a need for improving the productivity and recommends that it can be done by improving the quality of labour compensation such as providing reward to their workers [7].
Financial performance of sugar industries in India has also been studied by Balasubramanian [8], while Nikhil Assar has made a comparative analysis of Indian sugar industries pre and post 2000 [9]. Profitability analysis for investing in sugar industries is researched by Oxfam International [10].
According to CARE Report on Indian Sugar Industry, the lack of linkage betweensugar and sugarcane prices leads to cyclicality. Thus, there is a need to devise appropriate sugarcane pricing model which can ensure a long term sustainability of the sugar industry and also prove beneficial to farmers. In major sugar producing countries like Brazil, Australia and Thailand the revenue sharing model of sugarcane pricing is followed [11].
The Rangarajan committee report on deregulation of Sugar sector in India had prepared as comprehensive report explaining the various aspects of Sugar business in India; the cyclicality in the production of sugar cane and sugar in India andthe various aspects of control. The cane reservation area and the minimum distance criterion, their implications, and the options that can be considered for bringing in greater efficiency and incentivizing increase of productivity were discussed. The report even dealt in depth with the important issue of sugarcane pricing and ways of revenue/value-sharing as the basis for fixation of cane dues. It explored in detail the constraints on mills with regard to pricing and release of sugar in the market. The trade policy with regard to sugar and the ways and means by which India can balance achievement of the twin objectives of playing a significant role in the global sugar trade and ensuring stable prices and supply in the domestic market are discussed. There is no control by the Union Government on production, pricing and distribution of molasses and there is no price control on the molasses in any State. However, the allocation and movement of molasses is controlled by the State Excise authorities. Sale of molasses is an important revenue stream for sugar mills. The committee is of the view that there should be no quota imposed (quantitative restrictions) on the mills for sale of molasses. Against a total country-wide estimated potential of 5,000MW based on this feed stock, about 2,000MW of capacity has already been created, The cost of generation is about `3 to 3.50 per unit, whereas preferential power tariffs set by State Electricity Regulatory Commissions (SERCs) are in excess of `4.25 per unit. Issues relating to cogeneration pertain toimplementation of Electricity Act provisions and regulations framed there under for all forms of renewable energy [12].
As per the ‘Report of High Powered Committee on Sugar Industry’, April 1998, the controls over the industry have to be abolished but selectively, ensuring regulations that are beneficial continues with necessary modification. The effect of cyclicality has been much steeper in India vis-à-vis rest of the world. The report recommended that the regulation over cane reservation area be continued ensuring the sustainability of the unit but the regulation over the price controls be lifted in two years. It also recommended that the subsidized supply of sugar through the PDS be discontinued and the subsidies be distributed on the other allowed food grains. But the cane prices were recommended to be regularized. A formula for calculation of the cane prices was recommended. The report recommended that the trade agreement be signed with the neighbouring countries and arrive at the net export demand so that the millers can plan accordingly. The report also recommended that the restrictions over the by-products from the industry have to be liberalized. Subsidy was recommended for the installation of boiler, for those industries which are willing to export the excess power to the SEBs. It also recommended that the power produced be allowed for selling in the nearby consumers with a reasonable wheeling charge. Similarly the report also recommended that the export of molasses be encouraged by liberalizing the restrictions on its export [13].
R.S. Deshmukh et al. developed a systematic approach for analysing in-bound logistics (the interfaces between the sugar industry and the farmers). In his methodology an attempt was be made to minimize harvesting to crushing time to obtain the maximum possible sugar recovery for enhancing the profitability. To accomplish this, farmers and millers should be treated as an inter-dependent enterprise. [14]
Jessica N. Lin in her thesis report explains that the political/legal aspects of global sugar cultivation are dominated by governments’ trade protections. Brazil has advanced technologies and practices that make sugar cultivation water and energy efficient. [15]
Fair Labour Report states that the Central Government sets a Fair Remunerative Price (FRP) for sugarcane just before starting of each season. Few states notify Statutory Advisory Price (SAP), which is above the FRP. As per the Supreme Court ruling, it is mandatory for mills to procure sugarcane at these prices. Majority of sugar mills operating in India are located near the sugarcane production areas to reduce transportation costs and to retain quality [16].
CRISIL report states that the disparity between sugarcane and sugar prices is highest in Uttar Pradesh followed by Tamil Nadu. The two states follow State Advised Price (SAP) account for over 50% of sugarcane production and about 40% of domestic sugar output. The impact of high sugarcane prices has been the most severe in UP where mills have witnessed very large decrease in net worth. [17]
Dion global solution report states that price de-control is a landmark for the Indian sugar industry. In February 2001, the Government of India restricted the distribution of levy sugar only to the families below poverty through the Public Distribution System. Under this framework, sugar mills had to sell 10% of their production to the government at a fixed rate of about `20 per kg and the government later supplied the same to the people via ration shops at `13.50 per kg. However, in May 2013, the government removed the obligation to supply sugar at subsidised rates for ration shops. This move of the government supports the industry within having cost efficiency, size, and ability to manage price volatility. This will also help the mills to use the extra money they earn from free market sales to pay cane farmers and go for bigger investment plans in future. [18]
IIFT report says that, the linkages between sugar, oil and ethanol prices are important considerations as the ethanol market continues to develop. Sharp increases in oil prices may tend to exert upward pressure on ethanol prices during harvest, and growing tendency to fix physical ethanol prices with the New York contract may emerge at times of volatile oil prices. The establishment of an international ethanol futures exchange was attempted during the oil crises of 1973 and 1979, however, failed due to lack of liquidity. As consumers react to the relative price differential between ethanol and gasoline, any increase in the price of gasoline stimulates demand for ethanol, reduces sugar exports and raises world sugar prices. At the world level currently, it is estimated that about 15% of sugar crops are converted into ethanol rather than sugar. [3]
Despite various state governments announcing incentives with respect to cane prices in the light of lower sugar realizations, the high cane cost of production coupled with the pressure on the sugar realizations continues to impact the conversion margins, although the hardening of prices is likely to bring some relief. [19]
Maurice R. Landes in his article about Government Policies in Sugar Industryof India states that there does not appear to be a consensus on any proposed measures that might reduce future volatility in sugar production and trade. [20]
According to the committee on revitalization of sugar industry report in August 2004, certain policy changes such as oxygenation of gasoline made compulsory, long term policy for blending of petrol with ethanol, prevention of frequent changes in PPA for cogeneration plants have to be implemented. [21]
The Report of the Working Group on Sugarcane Productivity and Sugar Recovery in the Country advocates that the Huge unexploited Domestic Ethanol Market in India with the huge captive consumption base for not only sugar but also for alcohol based by-products. Sugar industry paradoxically faces issues of sugar glut and idling industrial capacities, many a times in tandem, while the countries like Brazil with very minimal domestic consumption have nurtured huge sugar economies centred around the global sugar trade (by achieving lowest sugar production costs) and the utilization of Ethanol on a huge scale to meet domestic motor fuel requirements. It also explains that the Economics and Technology of Electricity Cogeneration along with sugarcane milling has been sufficiently well established in the country, now. While India has been the pioneer in taking early lead in this technology, the progress has been tardy. The present installed capacity for generation of surplus electricity by sugar mills for grids is around 3800MW against potential estimated to be in the range of 8800MW in minimum case scenario and 10500MW in best case scenario. The importance of by products such as bio-plastics, cellulosic ethanol, cellulosic gases (Syngas), bio-gases (CNG fropress mud as well as effluents) from the mills is explained. According to the report the industry needs to take note of the emerging opportunities and devise strategies for gaining early mover advantage [22].
India Stat Website compares the sugar industry in many companies with respect to the following variables: Working Units, Sugar Production, Cane Crushed, Production of Sugarcane, Molasses Produced, Gur/Khansari Production, Sugar Recovery, Population, Total Consumption Sugar, Per Capita Consumption of Sugar and Khandsari. [23]
The Indian Sugar Mills Association had been in favour of futures trading in sugar to provide a cushion to the industry once decontrolled. The National Federation of Cooperative Sugar Mills, the apex organisation of 250 cooperative sugar mills accounting for nearly 60% of country's sugar production, did not support it. The government, however, removed all restrictions on sugar exports and permitted commencement of future trading in white sugar. Futures contracts are traded in four exchanges, the three National Multi Commodity Exchanges (NMCEs), the National Commodities and Derivatives Exchange (NCDEX), and the Multi Commodity Exchange (MCX), besides E-Sugar Ltd. [24]
Gomathi Singh research explains that for bringing down the cost of cultivation, technologies like simultaneous planting of sugarcane with wheat using improved varieties and site specific nutrient management with emphasis on balances nutrition deserve due to increasing profitability of sugarcane based farming system. [25]
Researchers in humanities of IITB suggested that the sugar industries should take steps for effective organisation of labour, adopting sounder methods for increasing labour productivity and promoting industrial harmony in India at the present day world [26].
Quoting the USDA report, the GOI establishes a minimum support price (MSP) for sugarcane based on recommendations by the Commission for Agricultural Costs and Prices (CACP) and consultations with State Governments and sugar industry and cane grower associations. Four years ago, the GOI announced a new fair and remunerative price (FRP) system that links cane prices with miller’s sugar price realization. Several state governments augment the MSP/FRP, typically by 30-40%, due to political compulsions rather than market pricing. Sugar mills are required to pay the “state advised price” (SAP) to sugarcane farmers irrespective of the market price of sugar. A forecast of a smaller cane crop normally encourages sugar mills to pay higher cane prices, resulting in prices exceeding the MSP/FRP in most of the growing states. [27]
Javalagi and Bhushi’s paper [28] discusses the factors affecting the Indian sugar industries and explores the possible methods to improve its productivity. Strategic productivity management is one of the major strategies to overcome the problems faced by Indian sugar industries. Since a firms’ productivity can be evaluated in terms of financial ratios, financial factors can be used as a means of managing productivity. Selection of financial ratios from the available set of published ratios is done by correlation study between Total Factor Productivity (TFP) and financial ratios. Financial factors influencing productivity are obtained using factor analysis. The paper also proposes a set of possible ways by which productivity management could be done in Indian sugar industries.
It is observed from the above review of literature available on different aspects of sugar industry, profitability is influenced by cyclical nature of production function. It is not just farm level agro climatic conditions which influence but largely regulation, price and payment are impacting the industry. The sugar sector is impacted by induced cyclicality, since high sugar and sugarcane prices lead to increase in production at the cost of other crops. The resulting low prices for sugar impact the ability of mills to pay the farmers, thus leading to creation of arrears. High arrears lead to a significant fall in cane cultivation in the next year, leading to high sugar prices and increased attractiveness of cane. Reducing cyclicality and ensuring better management of downturns is the key policy imperative in the industry.
2.1 HYPOTHESES
Based on this it could be relevant to identify a few variables of representative large companies in the industry to study their financial performance and revalidate the inferences from the review of literature.
Our hypothesis is that defaulting payables is strategically regulating sugar cane production thereby claiming the rewards expected from the national market. Since the government’s regulatory intervention is only over the cane prices (by fixation of support prices) and sugar prices (by provisions of essential commodities act), the millers still enjoy pricing power over energy exports, ethanol, bagasse and manure. Thus the volatility in the sugarcane prices and sugar prices are often offset by their pricing policy over intermediaries or by the export of the additional sugar produced.
To sum up, the crux of the research is to establish the factors that drive the profitability of the industry and the way to establish it is by measuring the profitability as a function of multiple factors based on which we have formulated our hypothesis.
1. Cyclicality influences inventory pile up at sugar mills.
2. Due to the supply demand curve shift the profitability of the firm decreases with increase in production.
3. The increase in production decreases the ability of the firm to pay the farmers (vendors) in time.
4. Increased productivity of sugar mills negatively affect accounts payable.
3. METHODOLOGY
The study is based on secondary data which collected through various journals, publications, company reports, financial statements etc. These include information from NCAER, ISMA, and CRISIL etc. The goal is to have an ideal mix of both real time and statistical data to decipher the trends in the industry and to understand whether these trends are in sync with the real life situation.We have spoken to about thirty six professionals from the industry, analysts and policy makers to validate our observations.
We have identified five sugar industries located in India namely: EID Parry, Shree Renuka Sugars, Balrampur Sugars, Bajaj Hindustan and Dhampur sugar mills and collected their financial statements. These industries are in existence for over three decades and have seen the ups and downs of this industry. They together contribute to nearly 25% of market share as of 2011. We believe that five year analysis of their financial performance will provide insights of the financials and would be representative of the behaviour of other organisations in this industry.
The following financial and physical parameters which would impact financials and paired relationship are mentioned below:
Sales growth and Margin change: Sales growth is captures increase in sales, Increase in sales could be because of volume increase or price increase or a combination of both. Margin change would impact sales growth as increase in volume would bring pressure on price leading to downward spiral. We study the correlation between high production levels achieved and margin percentage in the respective years.
Inventory turnover ratio: This provides an idea of how fast the sugar sold during different phases of the cyclicality. Though sugar is a seasonal industry where factories crush on an average 200 days, it may have to pile up stock to be released during lean months. However volume stock would vary based on number of crushing days and capacity utilised or could be affected by poor off-take. Hence we discuss inventory turnover ratio from this perspective as more inventory may lead to inefficiency.
Accounts payable turnover: This is an important ratio which will provide information on how long the industry took to payback the credits it owes to the farmers during different phases of the cyclicality.
Fixed asset turnover ratio and Operating Expense Ratio: During the crests of cyclicality the sugar production increases which will probably help the organisation achieve economies of scale. This can be verified by comparing the Fixed Asset Turnover Ratio and Operating Expense Ratio.
Working Capital Ratio, Quick Ratio and Cash Reserve Ratio: These ratios provide insights on the networking capital of the organisations over the years and the ways in which the organisations financed it. Further we may probe whether the industry really struggling to payback the credit and if so at what production levels.
Other financial data are also collected to arrive at other ratios such as Debt-to-assets ratio, Debt-to-capital ratio, Debt/Equity Ratio, Debt/Equity Ratio, interest Coverage Ratio, Debt-Service Coverage ratio, Gross Profit Margin, Operating Profit Margin, Net Margin, ROA and ROE to support and substantiate our findings.
4. RESULTS
To verify whether the cyclicality really affects profitability of sugar mills, we compared the production levels over a period of 5 years with various profitability ratios, efficiency ratios, solvency ratios and Liquidity ratios.
4.1 CHANGE IN CANE CRUSHING vs CHANGE IN MARGIN
When there is an increased production of sugar cane, the mill owners are obligated to crush more sugarcane, whether or not there is an increase in demand for sugar or its by-products in the local or international market. Changes in the quantity of cane crushed not only affects the quantity of sugar produced but also the quantity of other by-products produced. As per the claims of Sugar mill owners increased production of sugar leads to lower price for sugar in the market which affects its profitability.
We compared the change in quantity of cane crushed to the chance in margin in the corresponding years and the results are presented as below.
Primarily the study was conducted to identify the profitability of the Sugar mills during the crest and troughs of the cyclicality of sugar production. For this purpose the relationship between the change in margin of different firms during a period of 5 years and the change in production levels in the same period was analysed and it was found that the two variables are correlated. The strength of the correlation is strongly positive. This indicates that whenever the production of sugar and its by-products goes up the profitability of the mills goes up. Hence the second hypothesis that due to the supply demand curve shift the profitability of the firm decreases with increase in production is not validated. Now considering the price for sugar being regulated by the government, the change profitability of the firm depends on the quantity of the other products sold. We understand from interaction with industry experts that there is an impact on margin and production but not direct. There are a number counter balancing acts like increase in cane price, reduction in volume and environmental factors help the firms to normalize profitability, Moreover, accounting data is mainly from April to March whereas sugar year is between October to September, this helps for financial stability.
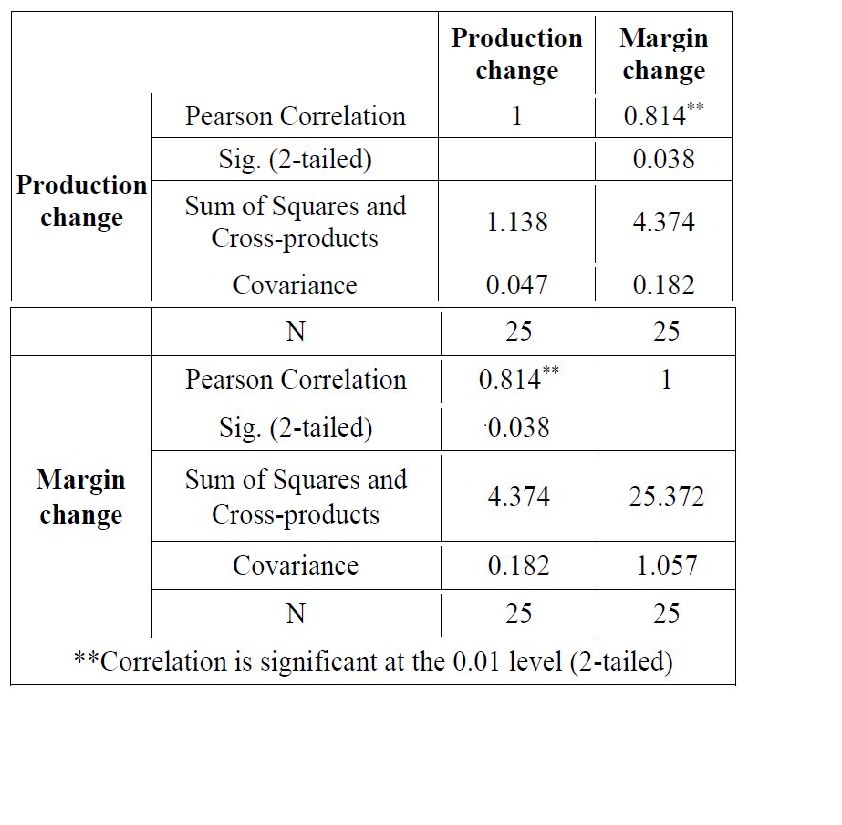
Table.1. Correlation between change in production and margin
4.2 ACCOUNTS PAYABLE RATIO vs QUANTITY OF CANE CRUSHED
To verify whether the quantity of cane crushed has strained the cash flows enough to make them default/delay payments to farmers we compared the accounts payable period for each company over a period of 5 years with the respective quantity of cane crushed in those years.
The study concentrates on whether how the other stake holders in the supply chain remain in the business. Let us consider the farmers, their job is simply to cultivate and supply sugarcane to the mills and get the payment for the supply. The problem would be whether farmers are paid properly? Is there defaulted payments or delayed payments that drive the farmers to cultivate other crops? The relationship between the quantity of cane crushed and the average payment period is studied and is found to be negatively correlated. However, it is not statistically significant here. It may be relevant here to relate with Dr. Rangarajan committee report. According to the report, 70% of the mill’s revenue goes to the farmers. This suggests that the mill owners do not pay the farmers in time when the production of sugar and its by-products goes up. It is that the mill’s profit increases with the increase in production and also it is clear that the inventory gets piled up when there is an increase in the quantity of finished goods produced. Hence the possible explanation for the third hypothesis “The increase in production decreases the ability of the firm to pay the farmers (vendors) in time” being proved is that the mills get expected profit even at the crests of cyclicality but it takes time for the market to absorb the sudden dumping of sugar and its by-products than the previous period and the mills thereby take time to pay the farmers.
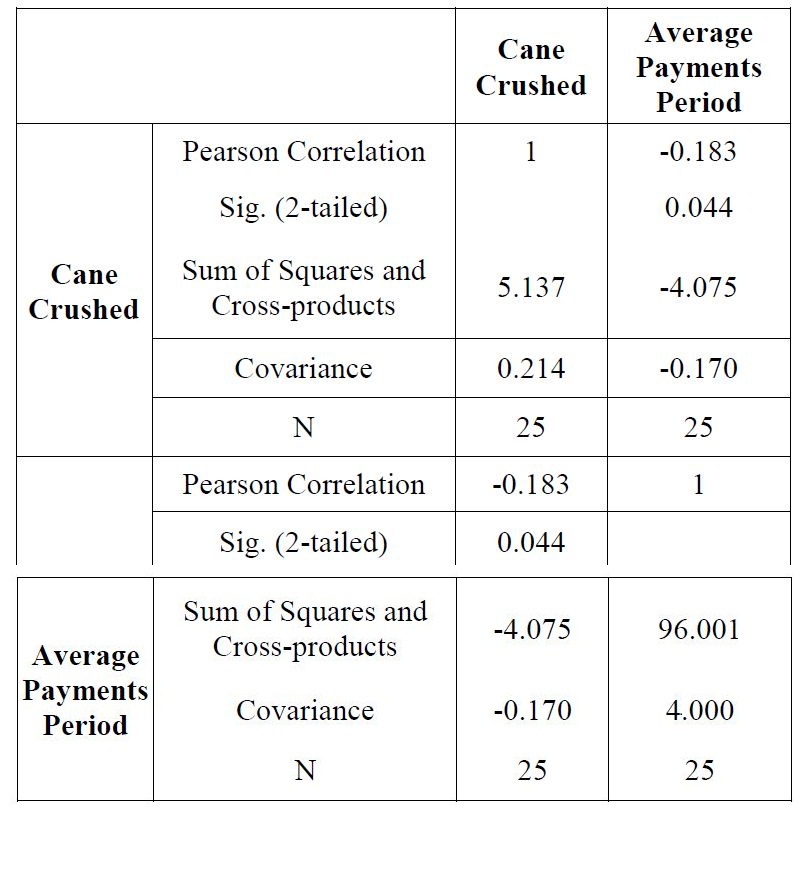
Table.2. Correlation between cane crushed and account payables
4.3 QUICK RATIO vs PRODUCTION QUANTITY
Companies default/delay payment to the farmers claiming that their cash is locked up in the inventory due to production exceeding demand. By comparing the quick ratio the cash and cash equivalents available with the company over a period of 5 years for various production levels, the claims of mill owners could be verified.
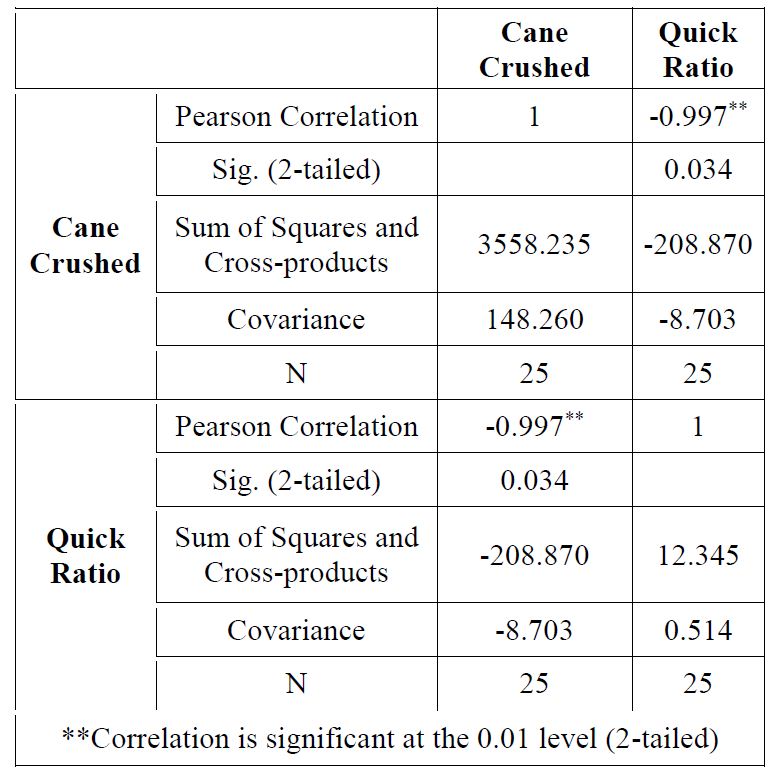
Table.3. Correlation of cane crushed and quick ratio
The relationship between the production quantity over the period of five years for all the five industries and the quick ratio for the industries over the corresponding years is studied and the results show that the two variables are inversely correlated. It suggests that whenever more cane is crushed i.e. the quantity of finished goods produced increases the mills assets become less and less liquid. This can be interpreted that the increased cane crushing results in shift of the supply curve to the right. In other words there is a possible dumping of Sugar and its by-products in the market. The sudden dumping is not absorbed by the market immediately and thereby there is increased inventory of finished goods. This makes the asset side of the balance sheet more illiquid. Hence by assuming that the sugar mills crush more sugar cane during the crests of the sugarcane production cycle the first hypothesis “Sugar mills pile up inventory of finished goods during the crests of the cyclicality” stands proved.
4.4 DEBT TO SERVICE RATIO
Another useful ratio to verify the claims of the mill owners is the debt to service coverage ratio which helps us understand whether the mills have a net operating income more than the trade payables, interest, and loan repayment obligations. This when compared across mills for over 5 years gives us an indication of how much the mills strain to meet their current and amortized long term obligations at different production levels.
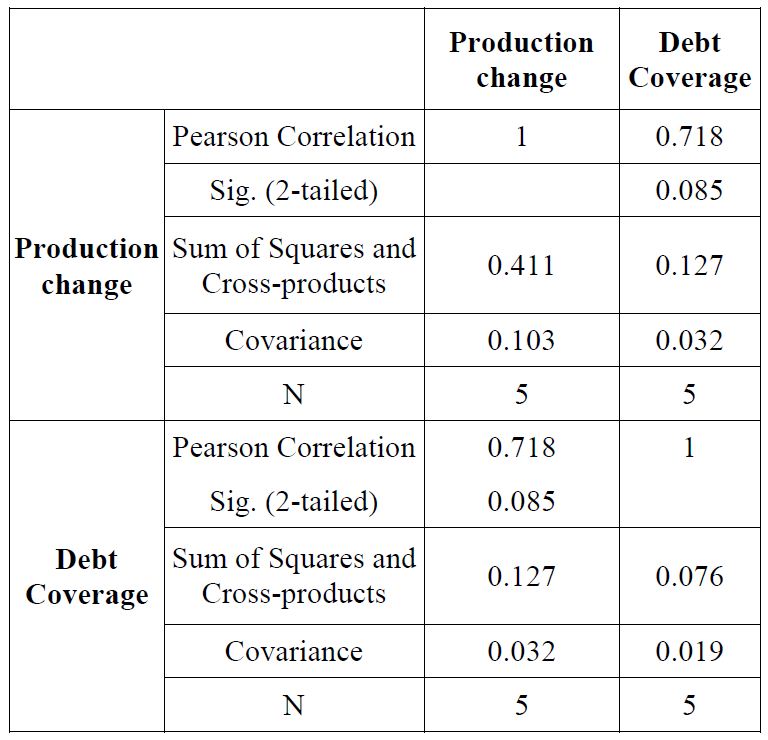
Table.4. Correlation production change and debt coverage
Finally when the relationship between the mills debt service coverage ratio and the quantity of production is observed it is found that the two variables are highly correlated.The relationship is not statistically significant. Since it can be interpreted that the increase in production allows the millers to service their debt commitments at ease, the fourth hypothesis “During the years of increased productivity the sugar mills are unable to meet their liabilities in the form of long and short term debts” being disproved by sign of correlation coefficient. However, when we discussed with industry experts the relationship which has turned out in our statistical analysis is influenced by large size of four five top performing companies in the industry. Second, variability of financial year and sugar year also gives support to manage financials better in terms of reporting. A large number of small and standalone sugar factories face the problem.
5. CONCLUSION
From the above discussion it is observed that the sugar industry is affected by cyclicality of production measured by cane crushed and other related factors. Accounts payable is not an insurmountable factor but delayed payments do affect farmers. Though inventory pile up is a factor, it is not hampering profitability over time. Hence a possible explanation for the sugar mills to exist in the business, while claiming that they are not able to pay the farmers back in time is just a strategy to regulate the supply (cultivation) of sugarcane by the farmers in the catchment area of their mills. From managerial standpoint, it is important to monitor cyclic trends, impact on cane procurement and profitability. It may be useful to note here that the sample is drawn from multi location and companies with related business using by-products.Standalone sugar mills may have severe financial stress during troughs of cycle.
REFERENCES
[1] “The Indian Sugar Industry Sector Roadmap 2017”, KPMG in India, 2007. Available at http://www.in.kpmg.com/pdf/indian_sugar_industry.pdf
[2] Sabapriya Ray, “Reviewing Performance of Indian Sugar Industry: An Economic Analysis”, Food Science and Quality Management, Vol. 3, pp. 35-53, 2012.
[3] “India’s Sugar Industry-Analysing Domestic Demand and Recent Trends”, Ministry of Agriculture, Government of India. Available at http://agritrade.iift.ac.in/html/Training/ASEAN%20%E2%80%93%20India%20FTA%20%20Emerging%20Issues%20for%20Trade%20in%20Agriculture/India%E2%80%99s%20Sugar%20Industry.pdf
[4] Sunil Kumar and NitinArora, “Evaluation of Technical Efficiency in Indian Sugar Industry: An Application of Full Cumulative Data Envelopment Analysis”, Eurasian Journal of Business and Economics, Vol. 5, No. 9, pp. 57-78, 2012.
[5] M.N. Murty, S. Kumar and M. Paul, “Environmental Regulation, Productive Efficiency and Cost of Pollution Abatement: A Case Study of the Sugar Industry in India”, Vol. 79, No. 1, pp. 1-9, 2006.
[6] Adya Prasad Pandey, “Indian sugar industry - a strong industrial base for rural India”, Munich Personal RePEc Archive, 2007.
[7] P. Chellaswamy and S.V. Revathi, “A Study on Growth and Productivity of Indian Sugar Companies”, IOSR Journal of Business and Management, Vol. 9, No. 5, pp. 1-10, 2013.
[8] M. Balasubramanian, “Financial Performance of Sugar Industries in India”, Global Research Analysis, Vol. 1, No. 4, pp. 4-6, 2012.
[9] Nikhil Issar, “Pre and Post Millennium Analysis of the Sugar Industry: ‘A Comparative Analysis of Developed and Developing Nations’”, 2013. Available at http://ssrn.com/abstract=2336611.
[10] “The Fijian sugar - Investing in sustainable technology industry”, Oxfam Briefing paper, 2005. Available at http://www.oxfam.org.nz/sites/default/files/oldimgs/fijian%20sugar%20industry.pdf.
[11] “The India Sugar Industry”, CARE Ratings Professional Risk Opinion, 2013. Available at http://www.careratings.com/upload/Research/IndustryResearch/Sugar.pdf
[12] “Report of the Rangarajan Committee on Deregulation of Sugar Sector in India”. Available at http://eac.gov.in/reports/rep_sugar1210.pdf, Accessed on January 25, 2016.
[13] “Report of High Powered Committee on Sugar Industry”, Volume II, Government of India Ministry of Food & Consumer Affairs (Department of Sugar & Edible Oils), 1998.
[14] R.S. Deshmukh, N.N. Bhostekar, U.V. Aswalekar and V.B. Sawant, “Inbound Supply Chain Methodology of Indian Sugar Industry”, International Journal of Engineering Research and Applications, 2012.
[15] Jessica N. Lin, “Sustainable Supply Chains in the Food and Beverage Industry”, M. Sc. Thesis, Natural Resources and Environment, University of Michigan, 2007.
[16] “Task and Risk Mapping of Sugarcane Production in India”, Fair Labour Report, Fair Labor Association, 2012.
[17] CRISIL Opinion, “Sugar prices set to bottom out”, CRISIL, 2014. Available at https://www.crisil.com/Ratings/Brochureware/News/CRISIL%20Research_Opinion_Sugar-Prices_13Feb2014.pdf
[18] “Indian Sugar Industry”, AFS Report, 2013. Available at http://reports.dionglobal.in/actionfinadmin/reports/fdr2205201343.pdf
[19] “Indian Sugar Sector; Improved Outlook Following Fiscal Benefits and Expected Supply Correction”, ICRA Report, 2014. Available at http://www.icra.in/Files/ticker/SH-2014-Q3-1-ICRA-Sugar.pdf
[20] Maurice R. Landes, “India's Sugar Sector Cycles Down, Poised To Rebound”, Report from the Economic Research Service, United States Department of Agriculture, 2010. Available at http://www.ers.usda.gov/media/146603/sssm26001_1_.pdf
[21] “Revitalization of sugar industry”, Tuteja Committee Report, Government of India, 2004.
[22] “The Report of the Working Group on Sugarcane Productivity and Sugar Recovery in the Country”, Government of India, Ministry of Consumer Affairs, Food and Public Distribution Department of Food and Public Distribution 2013.
[23] “Basic Parameters of Sugar Industry in India”, Available at http://www.indiastat.com/industries/18/sugar/268/sugarmillsandfactories19932014/449610/stats.aspx.
[24] “Market for Sugar Industry”, IndiaStat. Available at http://www.indiastat.com/industries/18/industrialsector/107700/sugar/268/stats.aspx
[25] Gomatee Singh, “Empirical Study on Economics of Sugarcane Cultivation and processing based farming in Uttar Pradesh”, Sky Journal of Agricultural Research, Vol. 2, No. 1, pp. 7-19, 2013.
[26] “Productivity in Sugar Industry”, Researchers in IITB.
[27] “Global Agricultural Information Network”, USDA Foreign Agricultural Sciences Department, 2013.
[28] Channappa M. Javalagi and Umesh M. Bhushi, “Factor Analysis Approach to Investigate Productivity in Indian Sugar Industries: A Financial Ratios Approach”, Journal of Business Management & Social Sciences Research, Vol. 3, No. 3, pp. 8-14, 2014.